Climatological Map by A.K. Johnston – Global Temperatures Chart 1852
€ 260
One of a kind: this is the sheet in the photographs. Ships from Langweer, the Netherlands.
Date
1852
Sheet size
34.5 × 27.4 cm (13.6 × 10.8 in)
Condition
Good
Reference
BG-13207-12
Condition
Very good condition. Light overall toning near the margins. The paper remains strong and well-preserved. Folding line as issued.
About this sheet
Climatological Map by A.K. Johnston – Global Temperatures Chart 1852
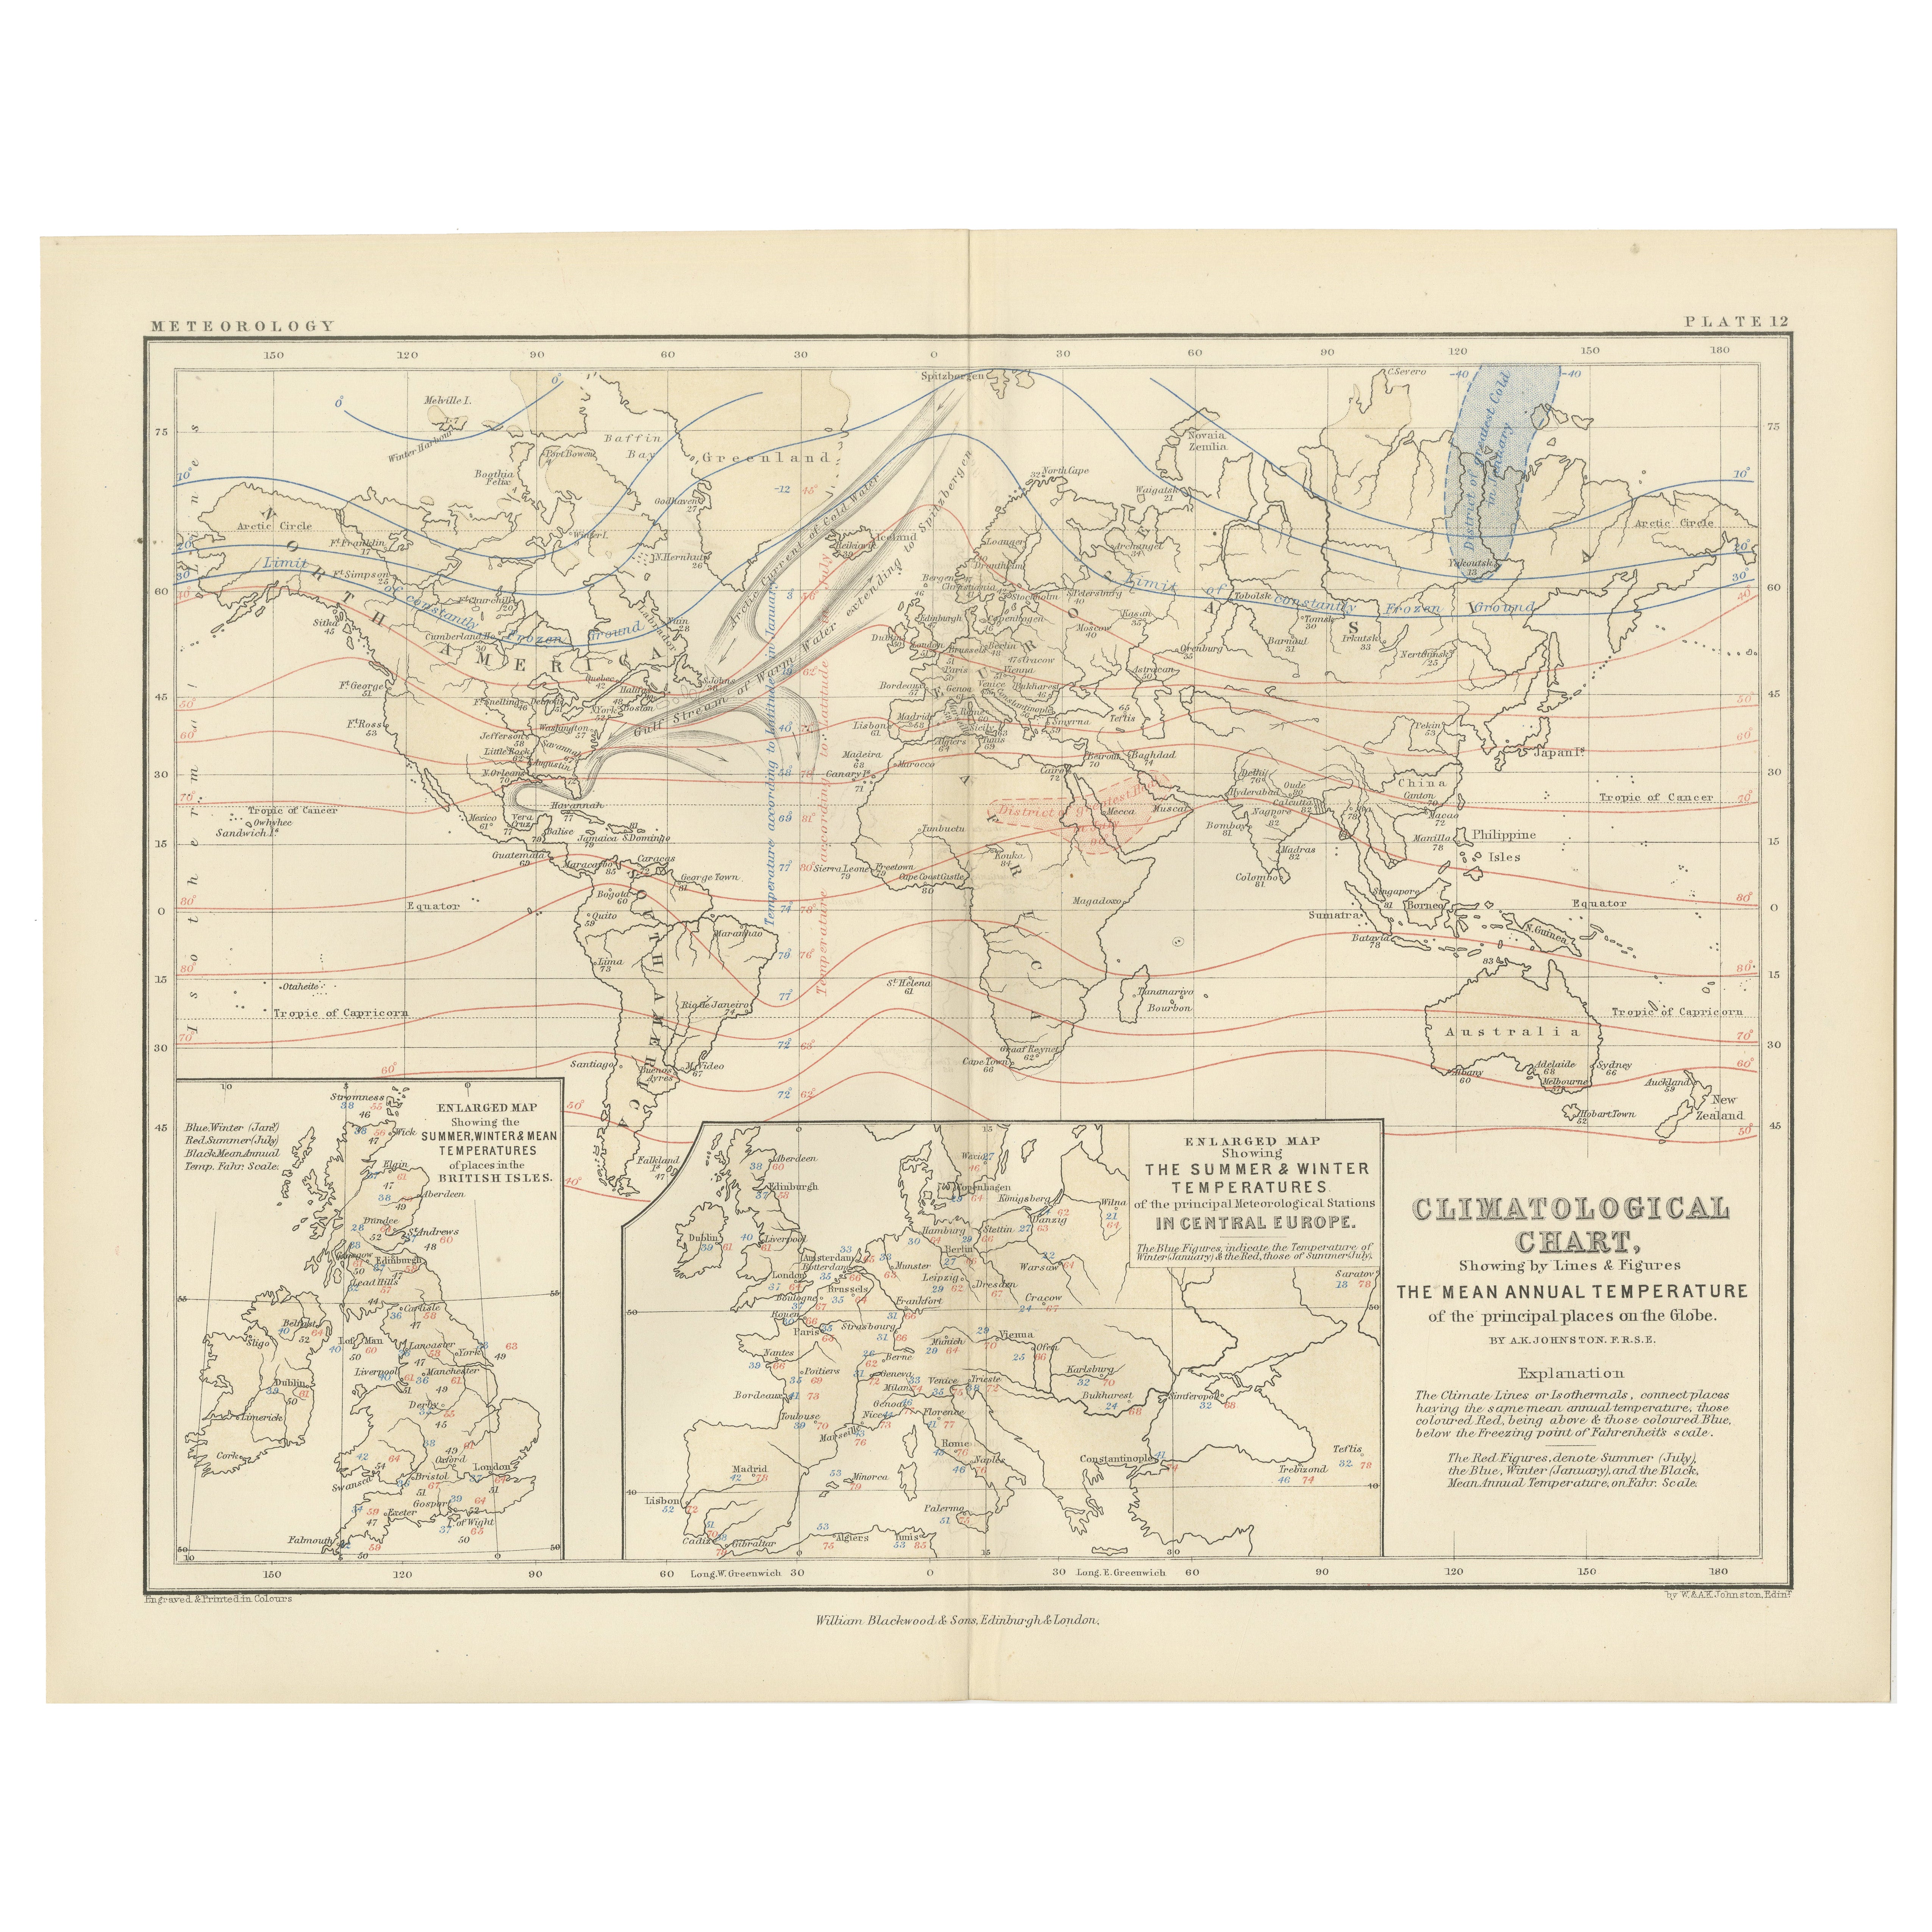
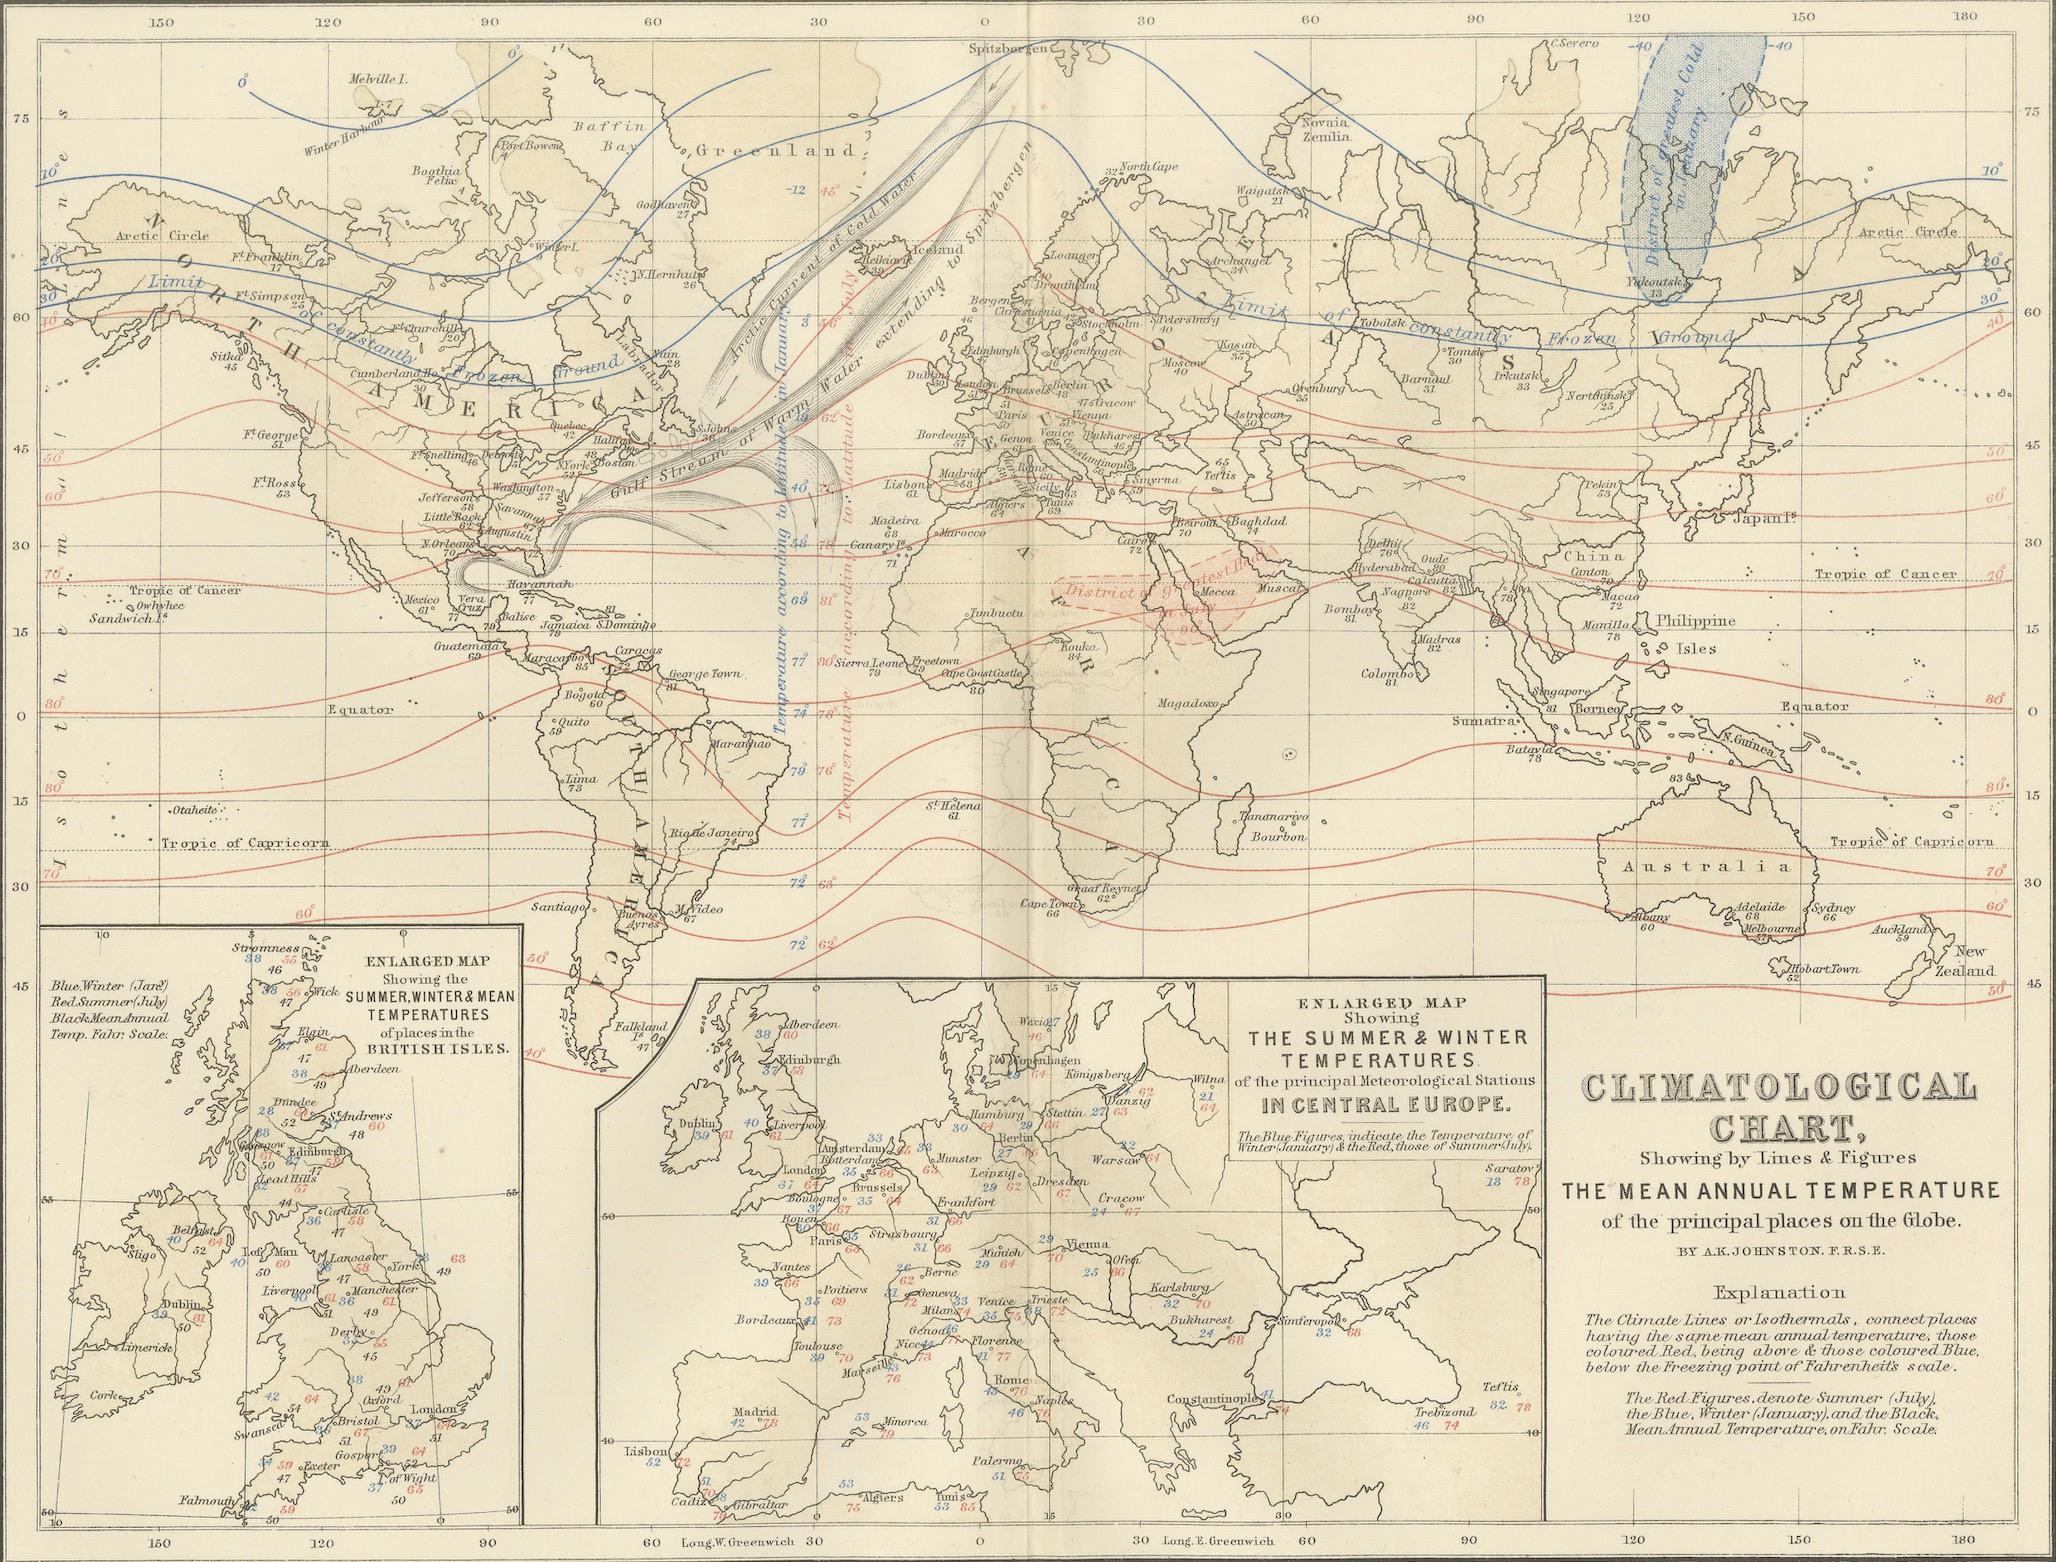
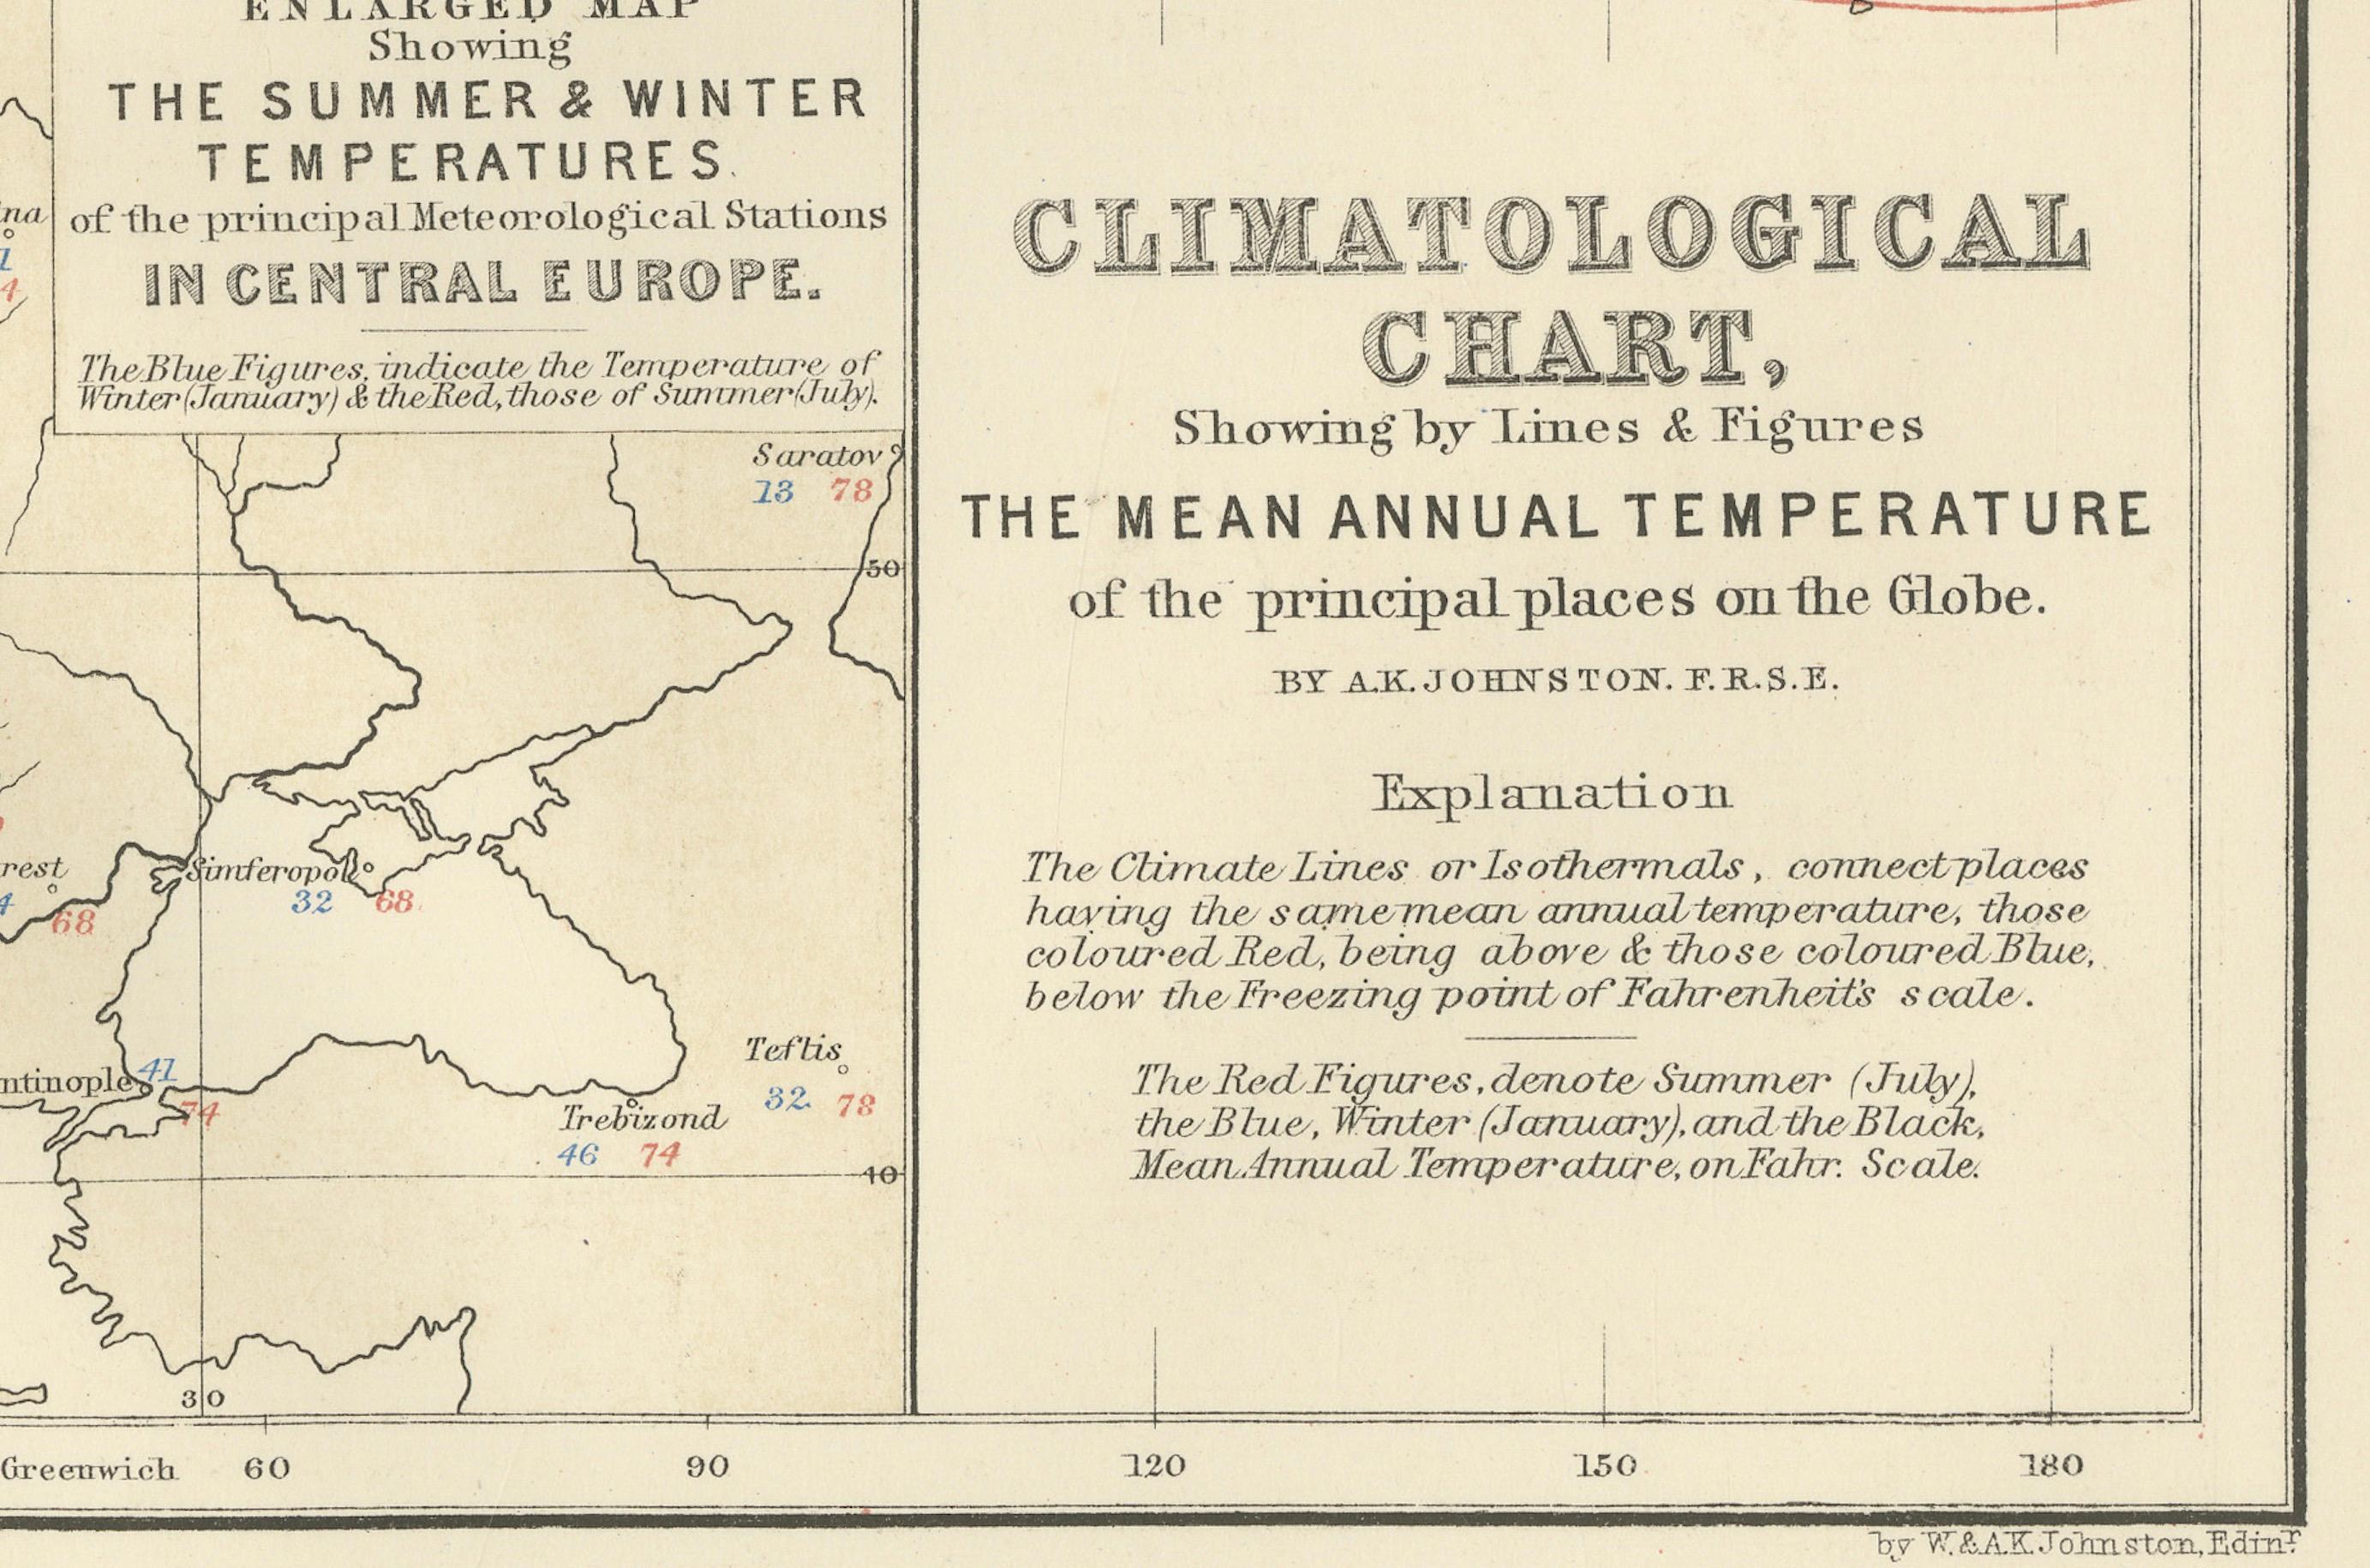
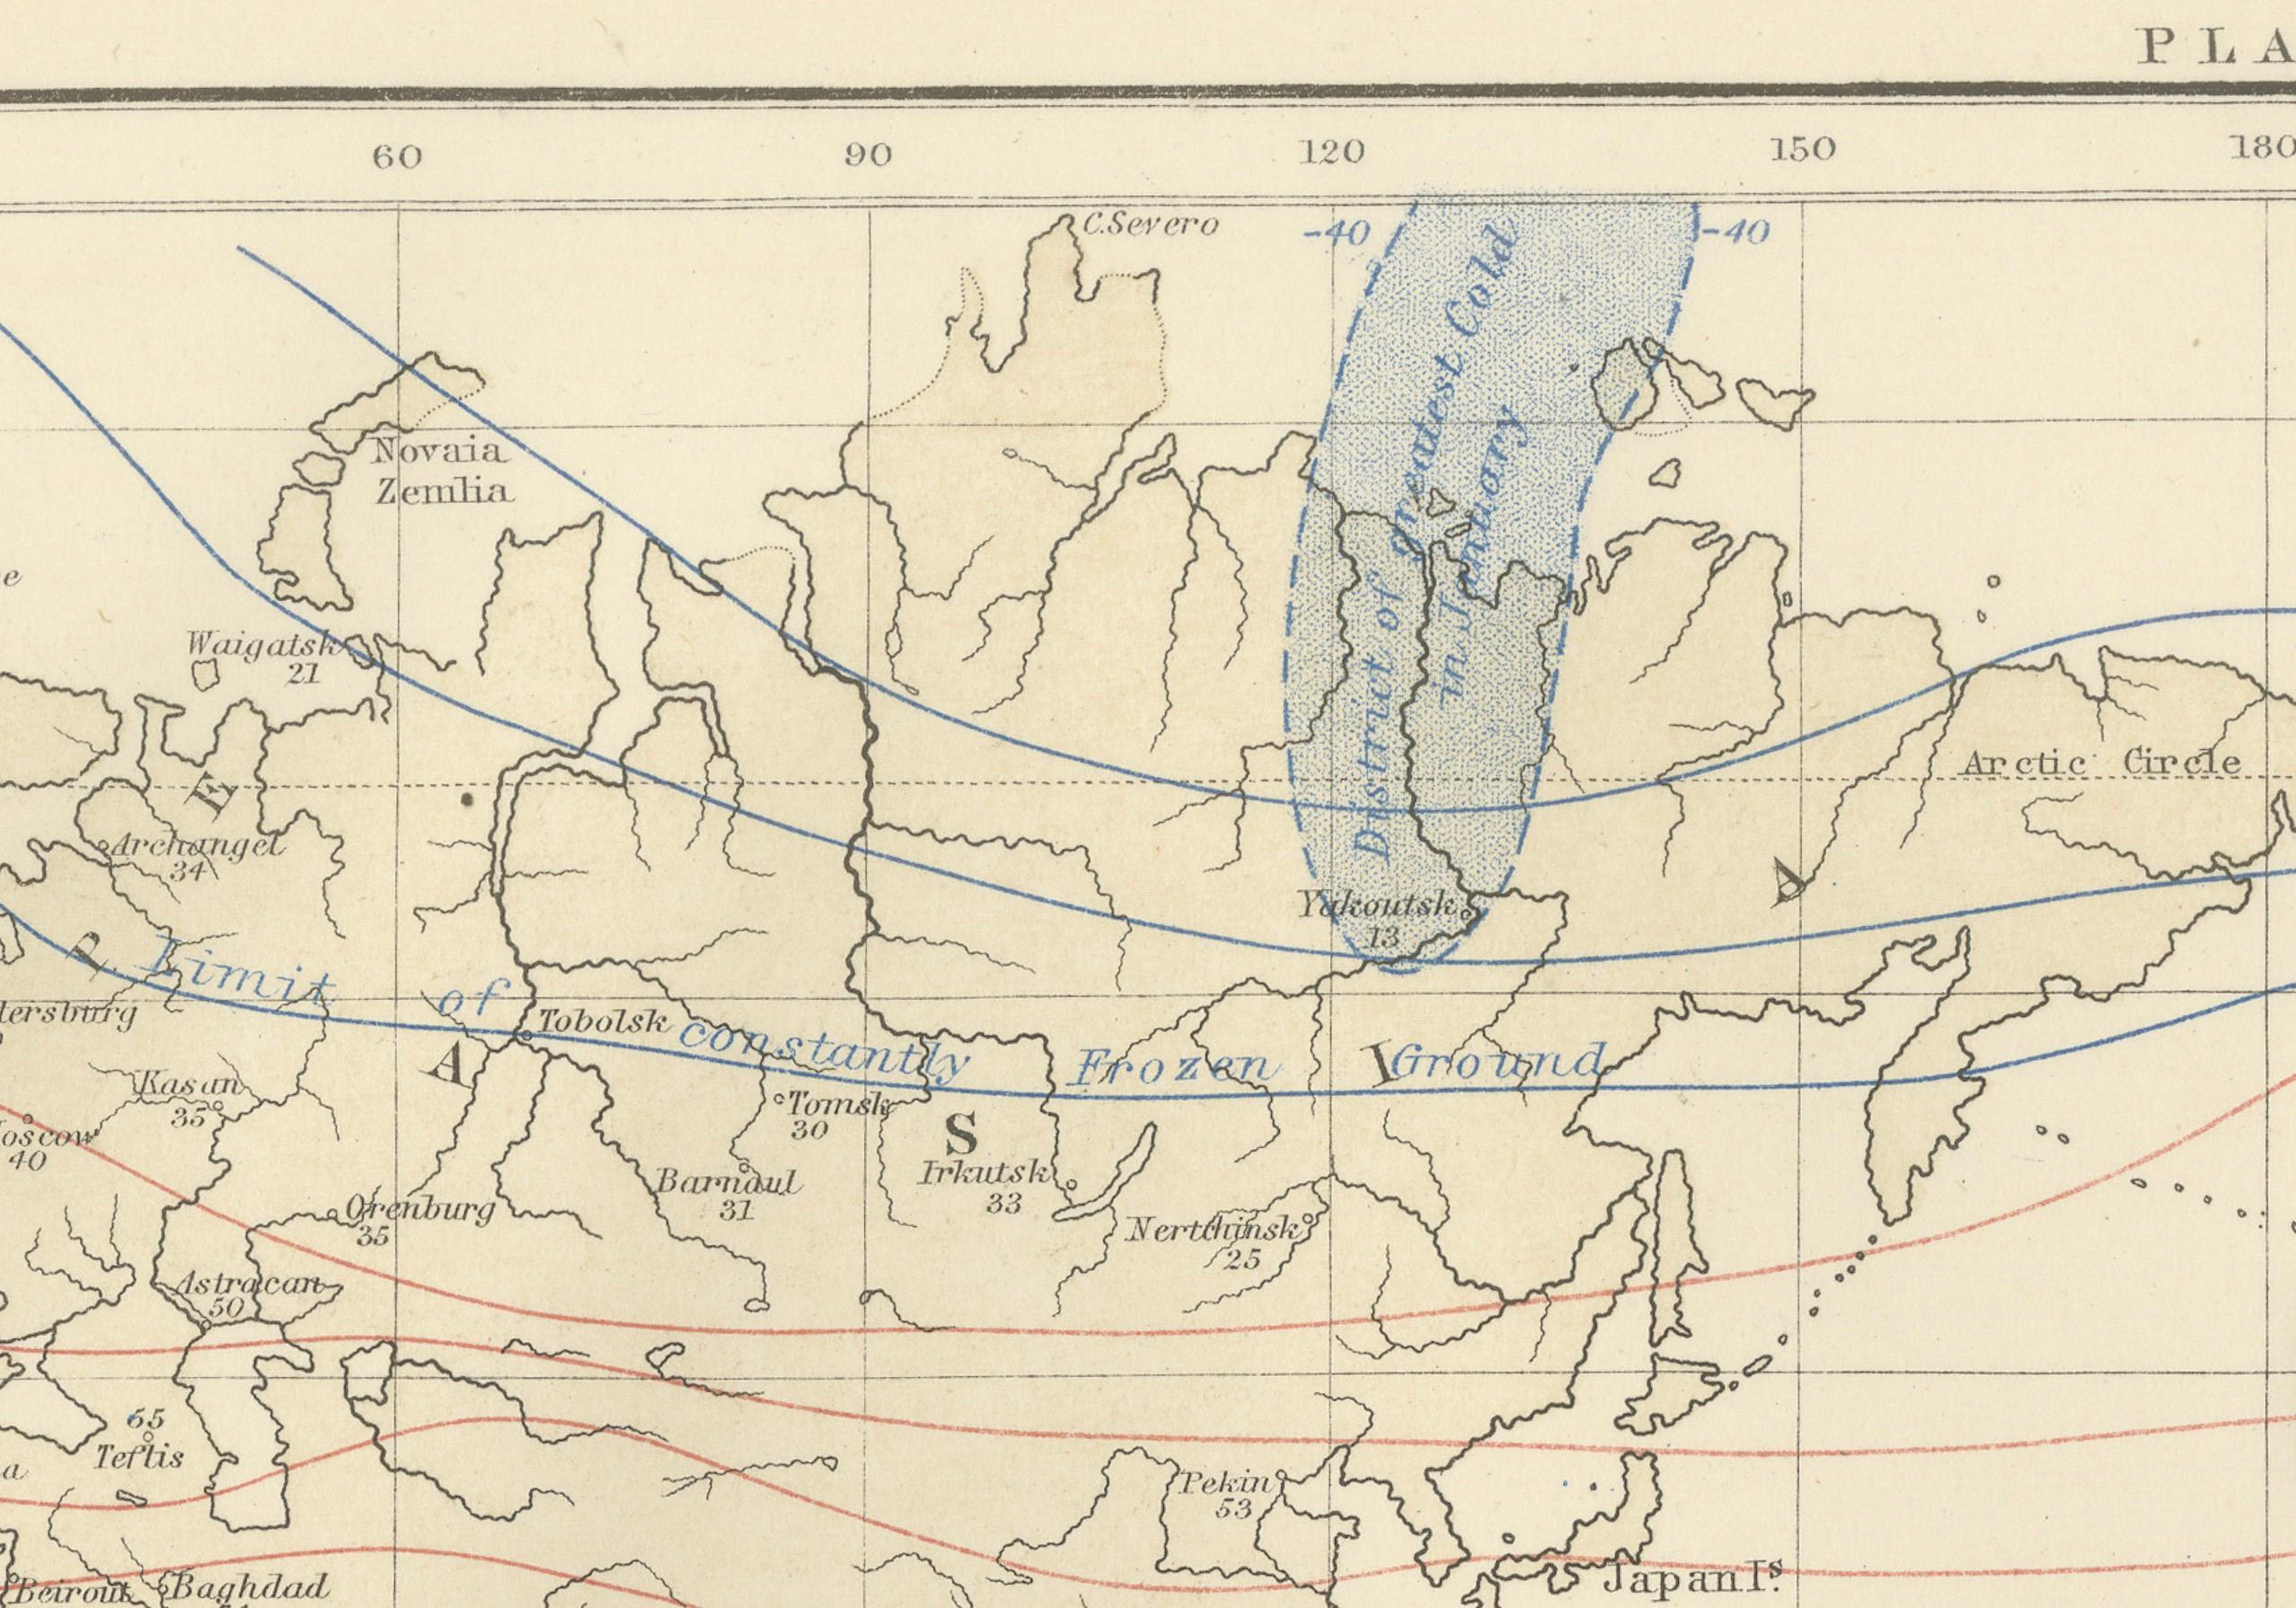
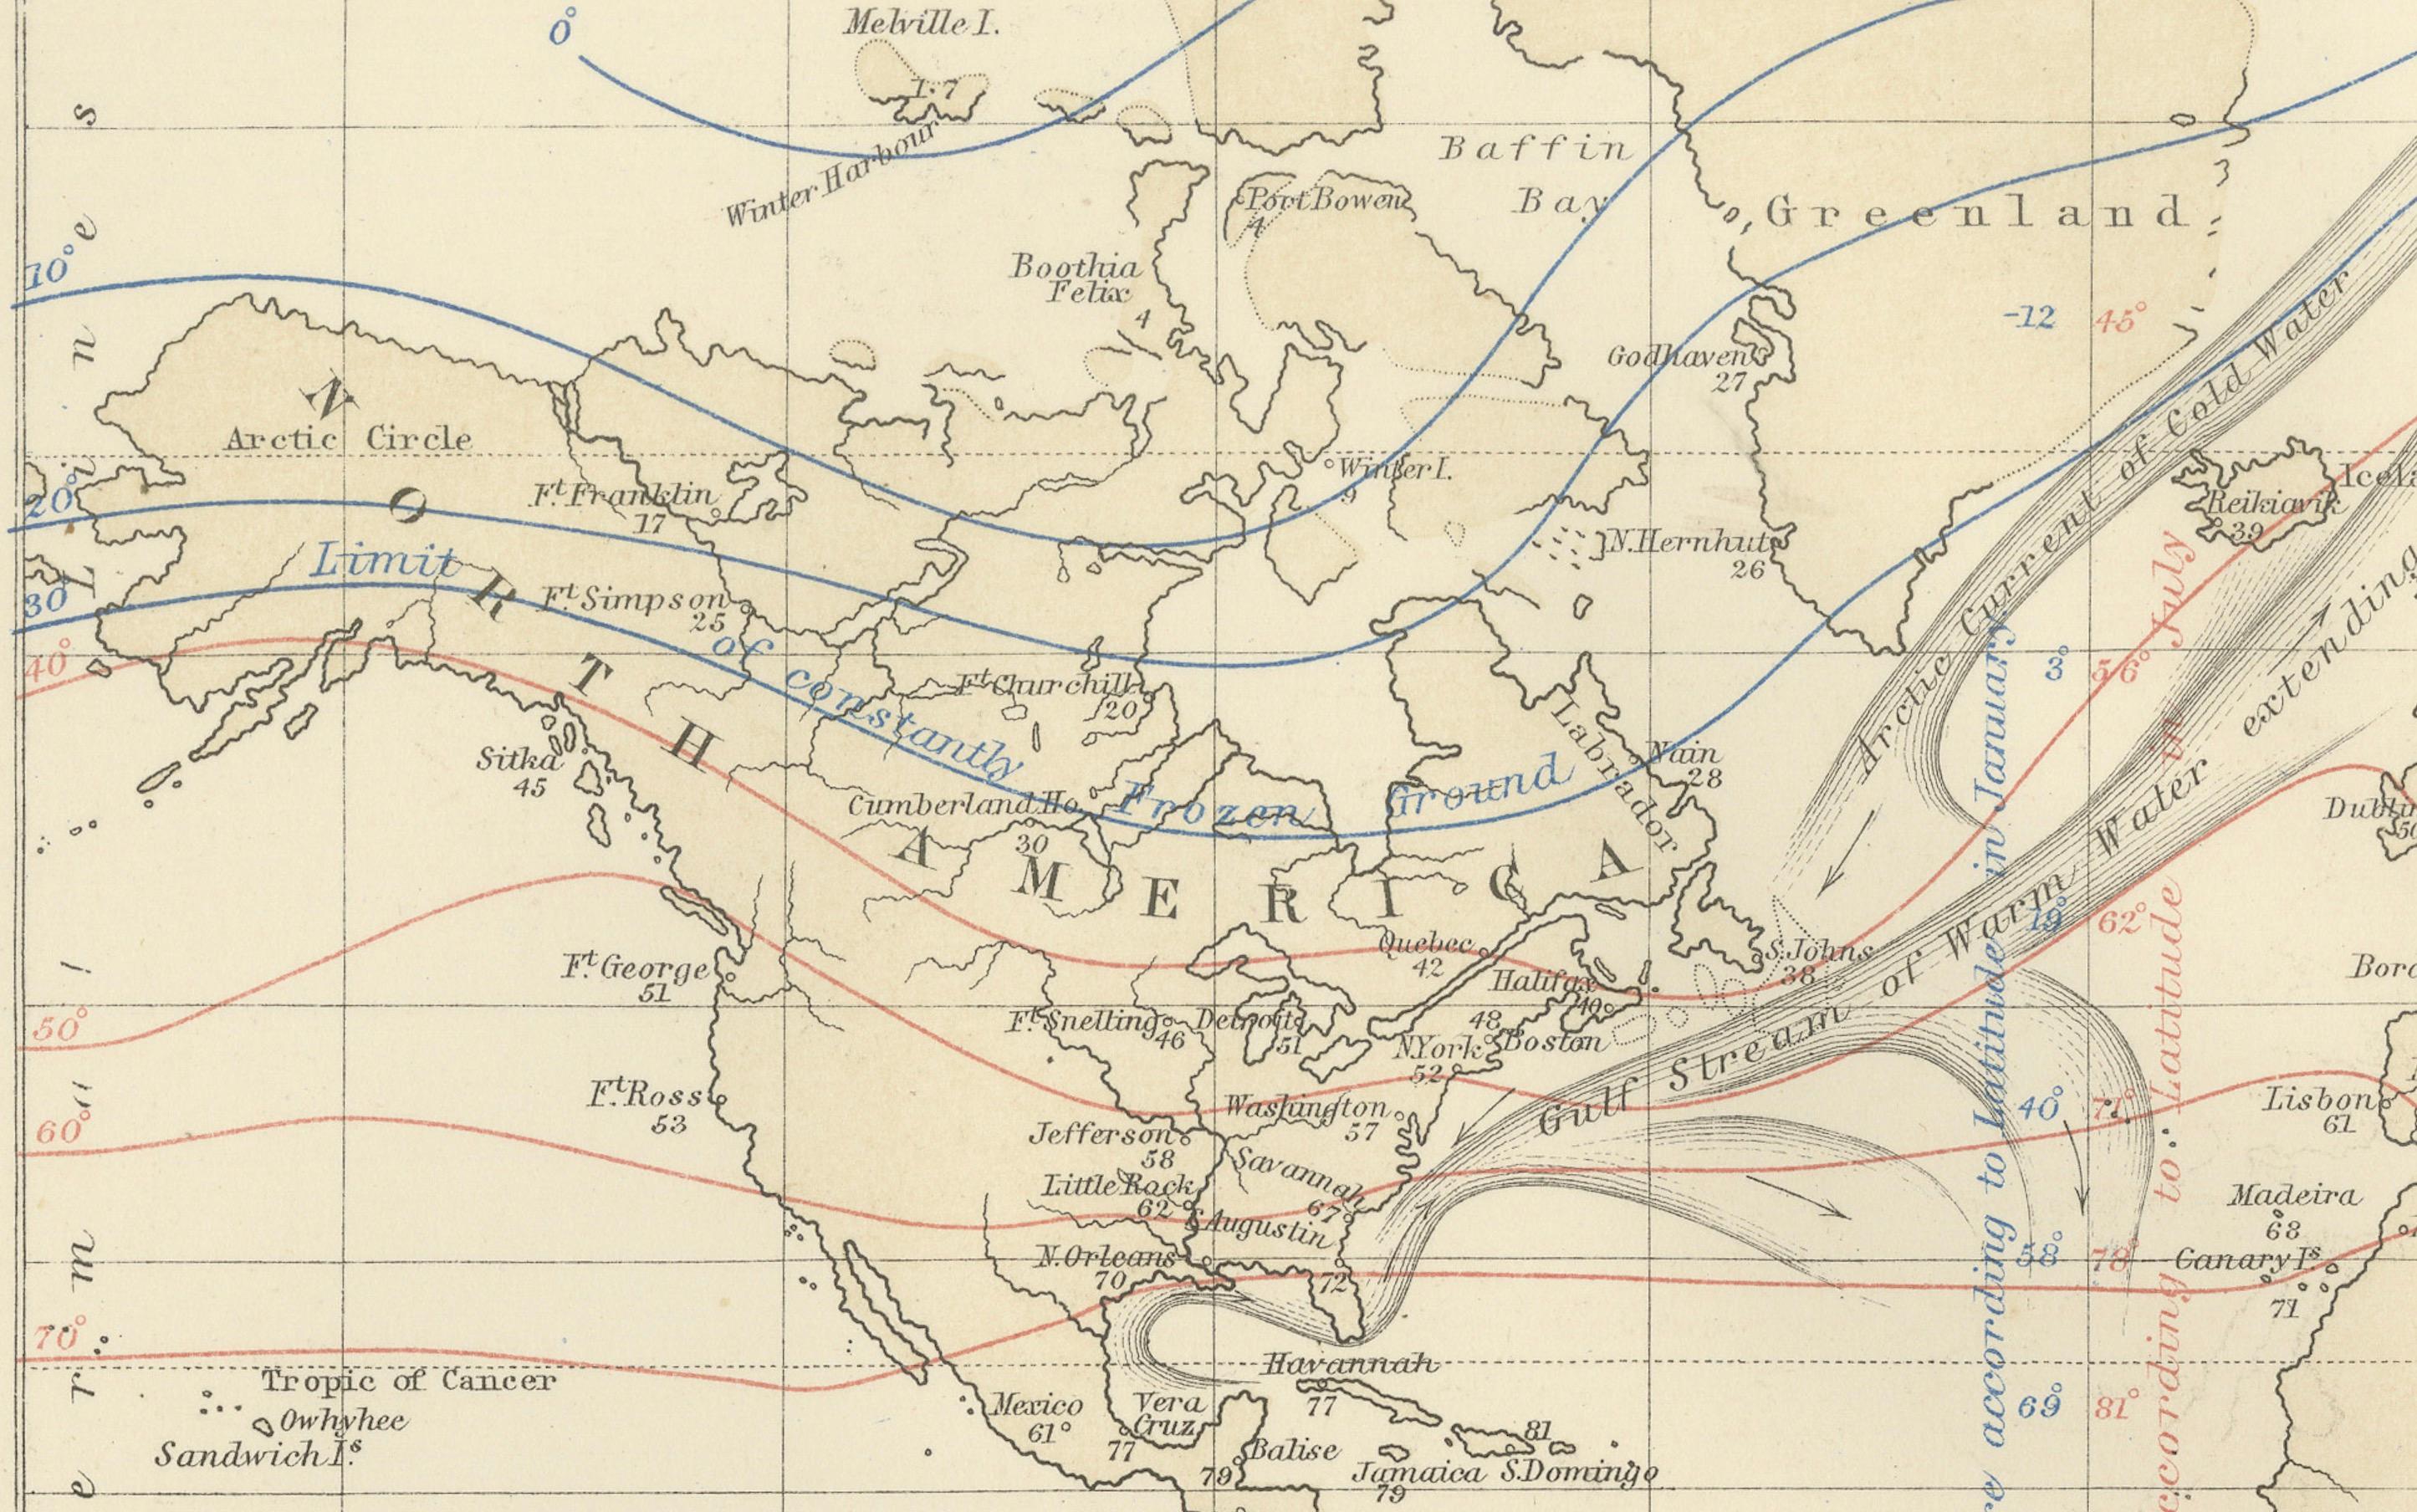
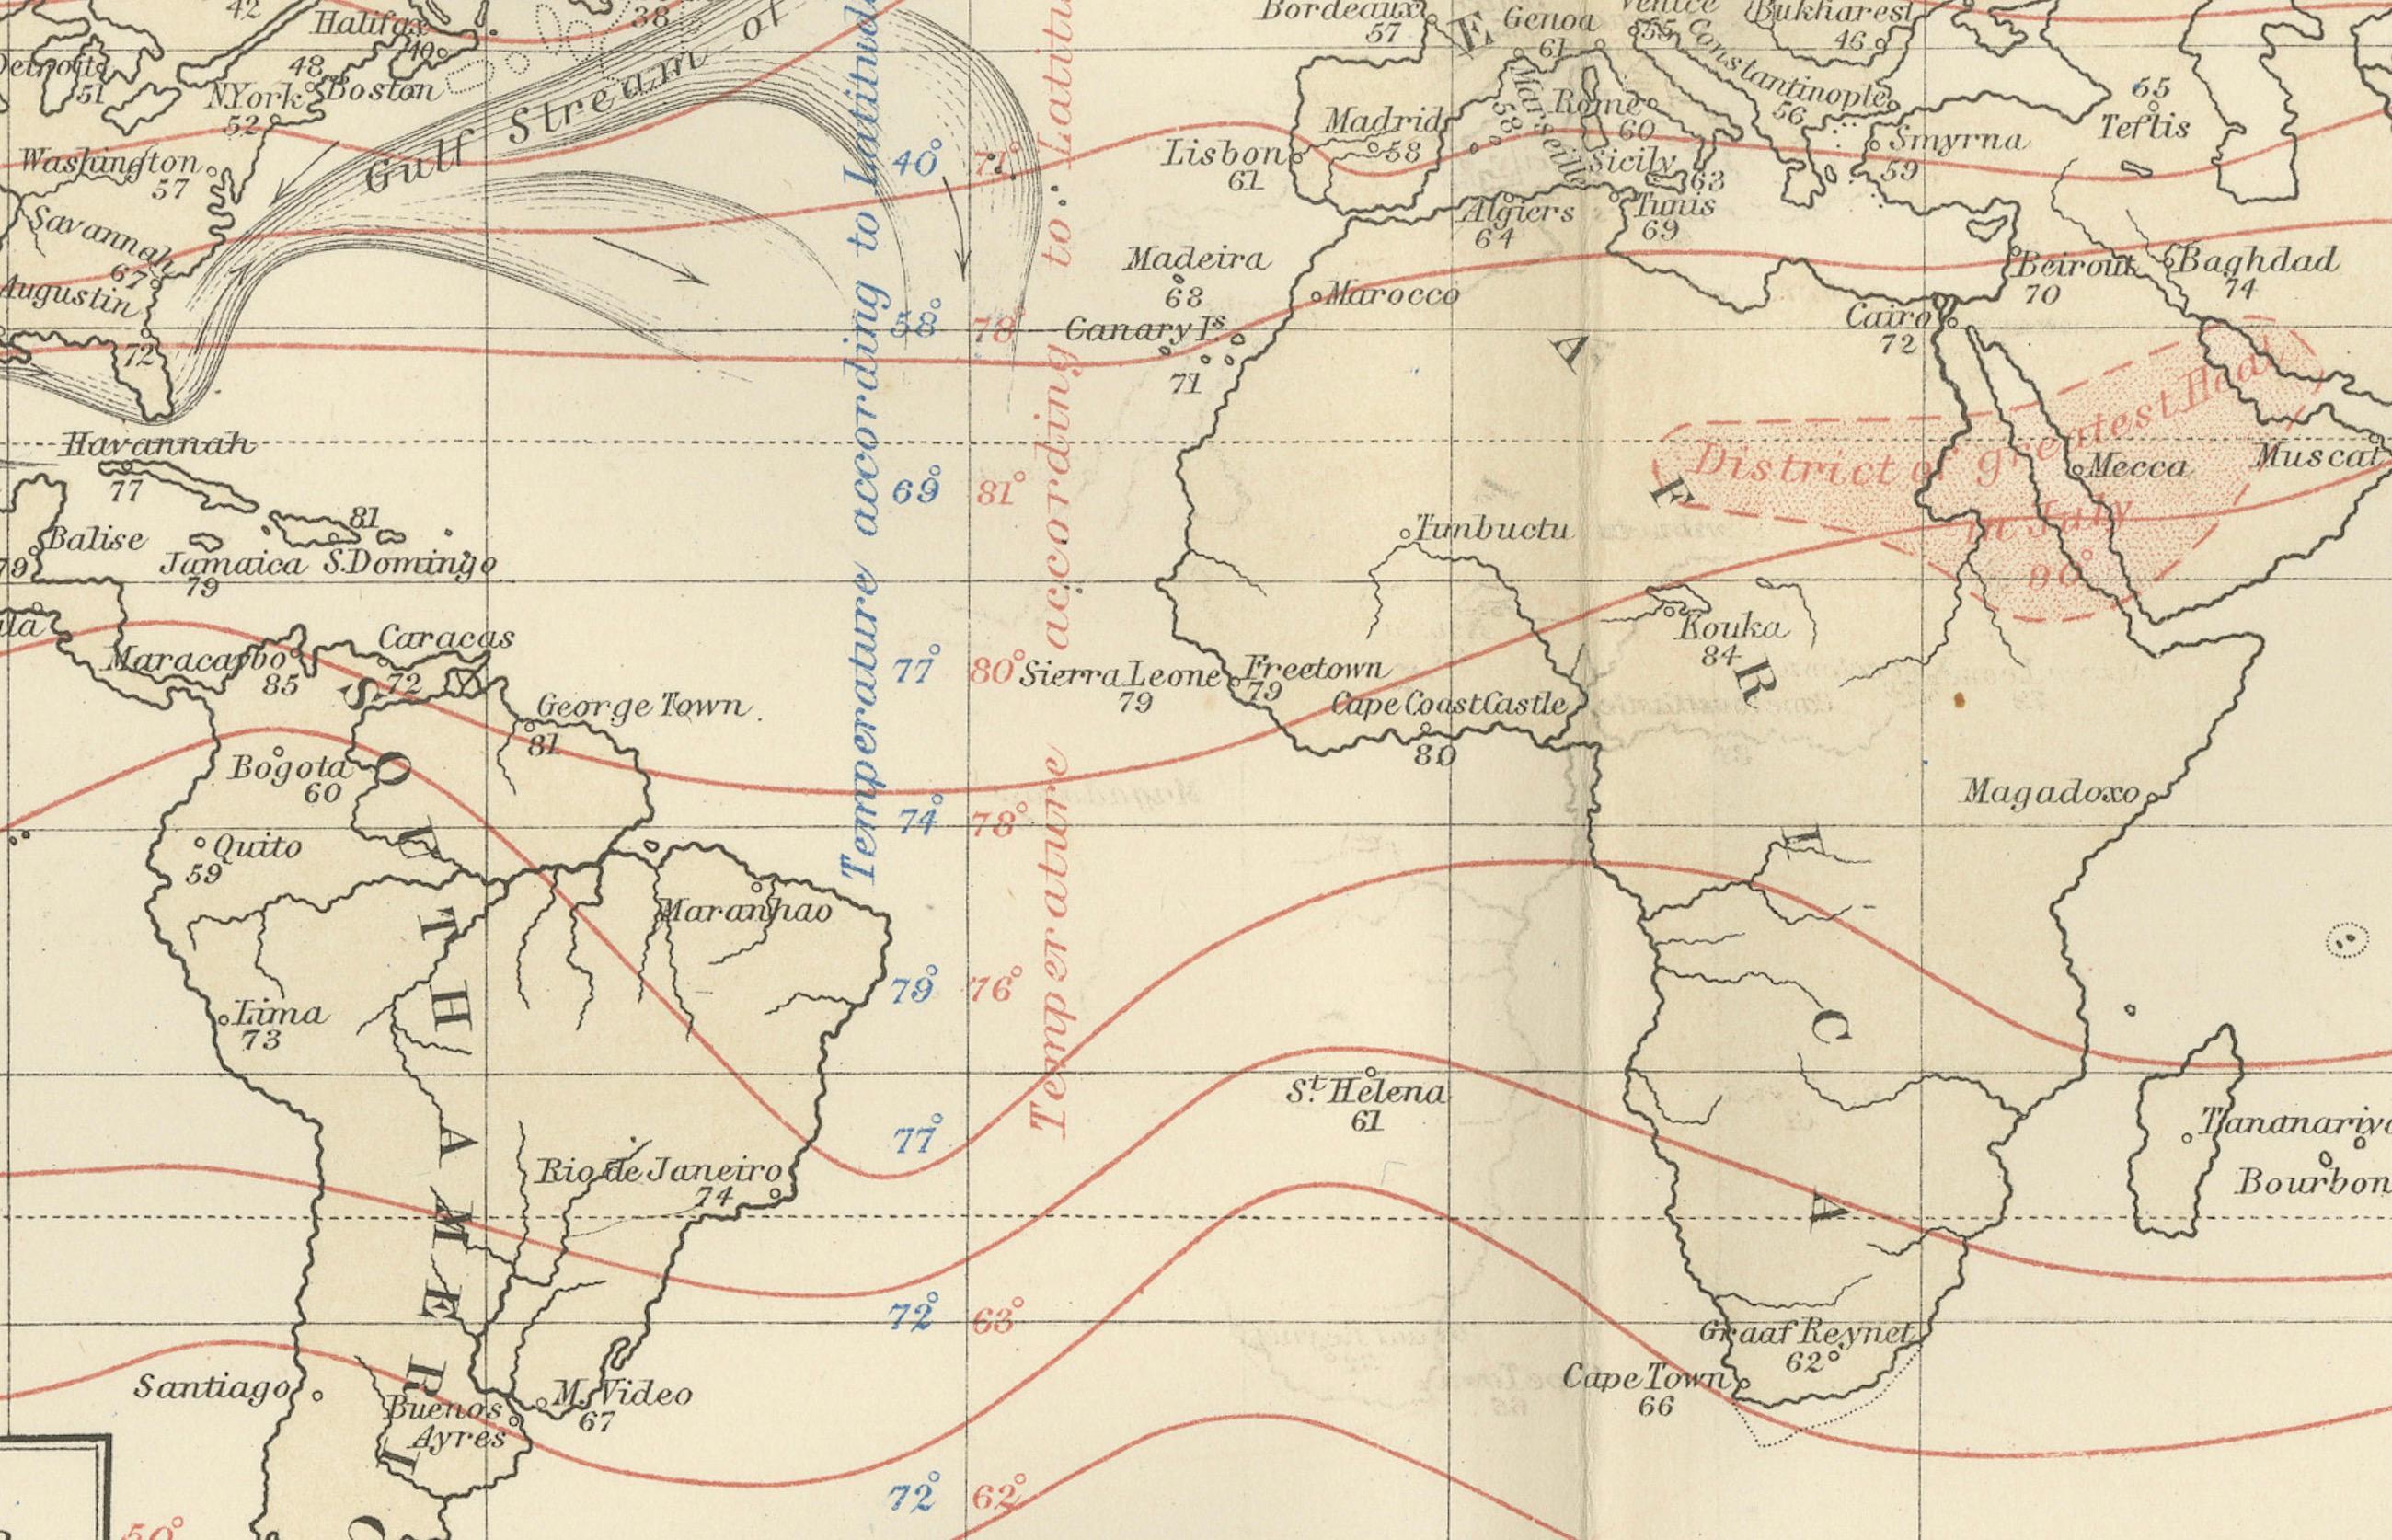
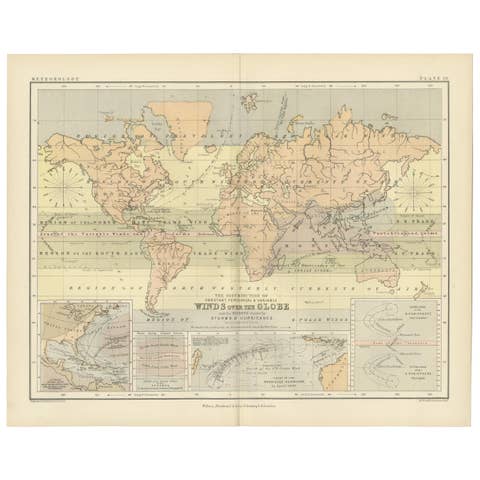
This exceptional antique map titled "Climatological Chart Showing by Lines & Figures the Mean Annual Temperature of the Principal Places on the Globe" was created by Alexander Keith Johnston and published in 1852 by William Blackwood & Sons of Edinburgh and London. It was issued as Plate 12 in Johnston’s landmark *Physical Atlas of Natural Phenomena*, a pioneering 19th-century atlas that brought scientific visualization into wide public use.
This map is an early attempt to systematically present global climate data. It displays mean annual temperatures across the world using isothermal lines (red and blue) that connect locations of equal average temperature. The isotherms are drawn with precise geographic accuracy and overlaid with data from major cities and meteorological stations. The red lines represent mean annual temperatures at various latitudes, while blue lines denote temperature during winter.
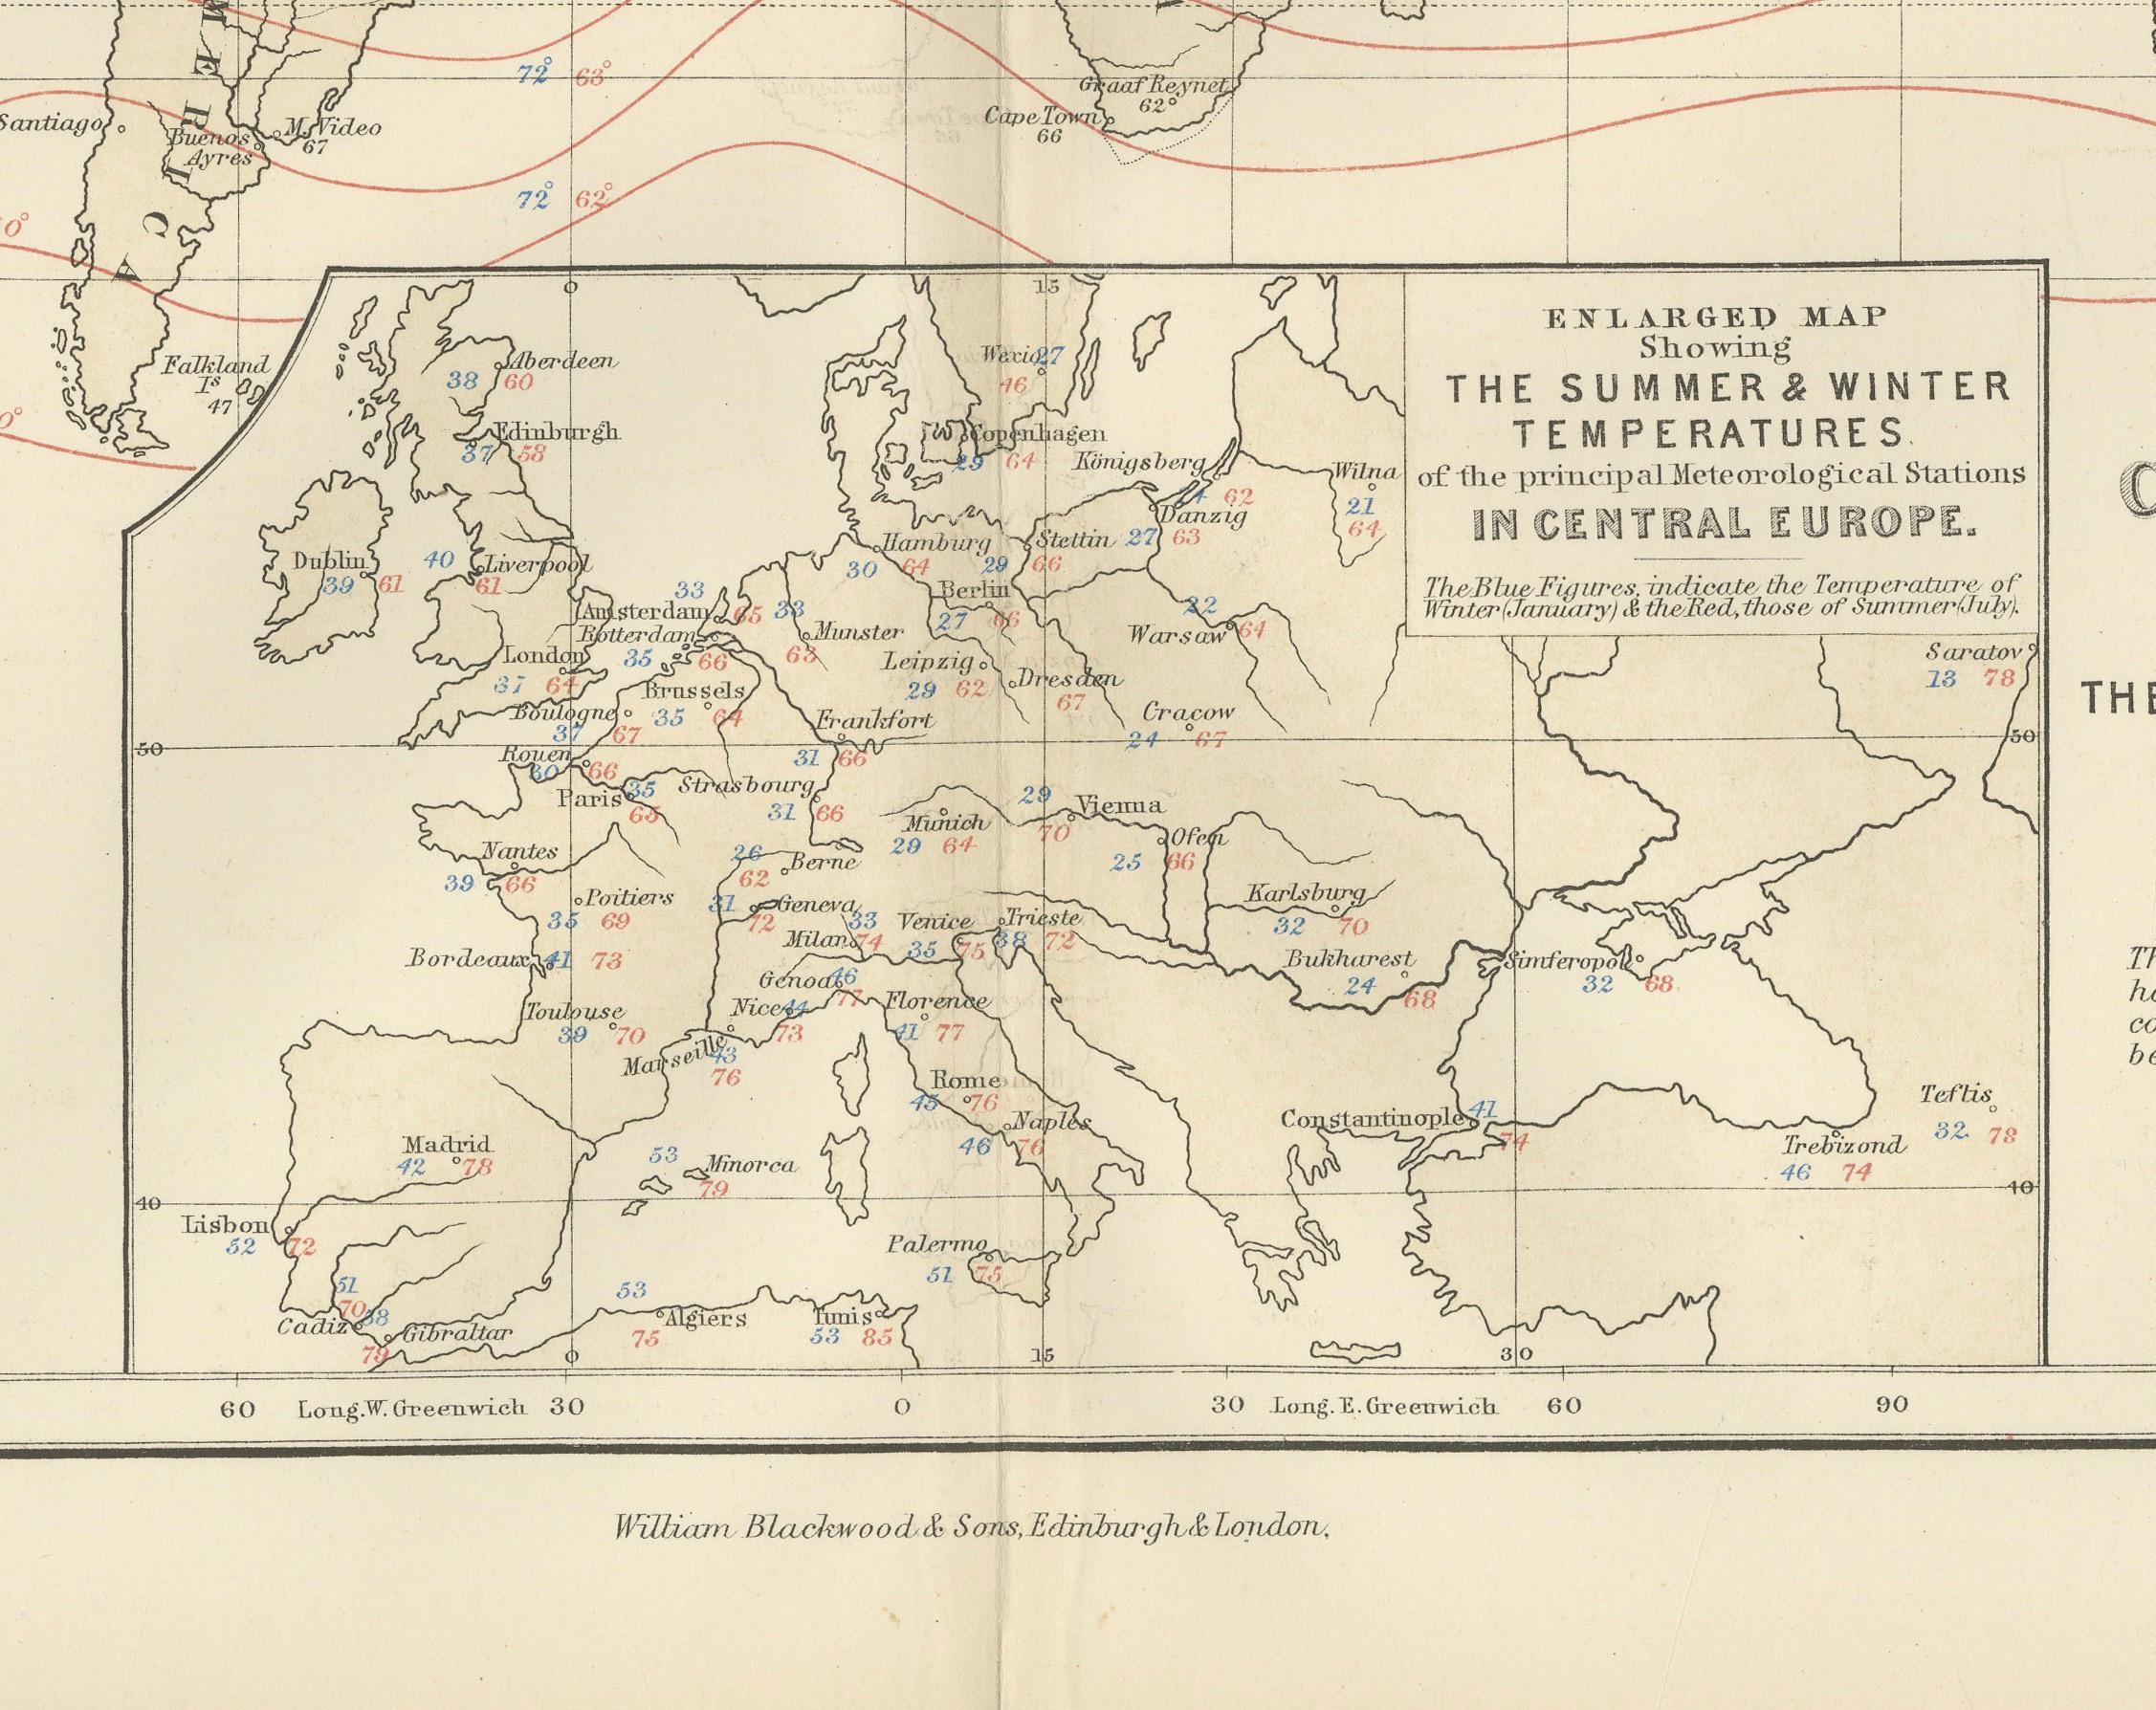
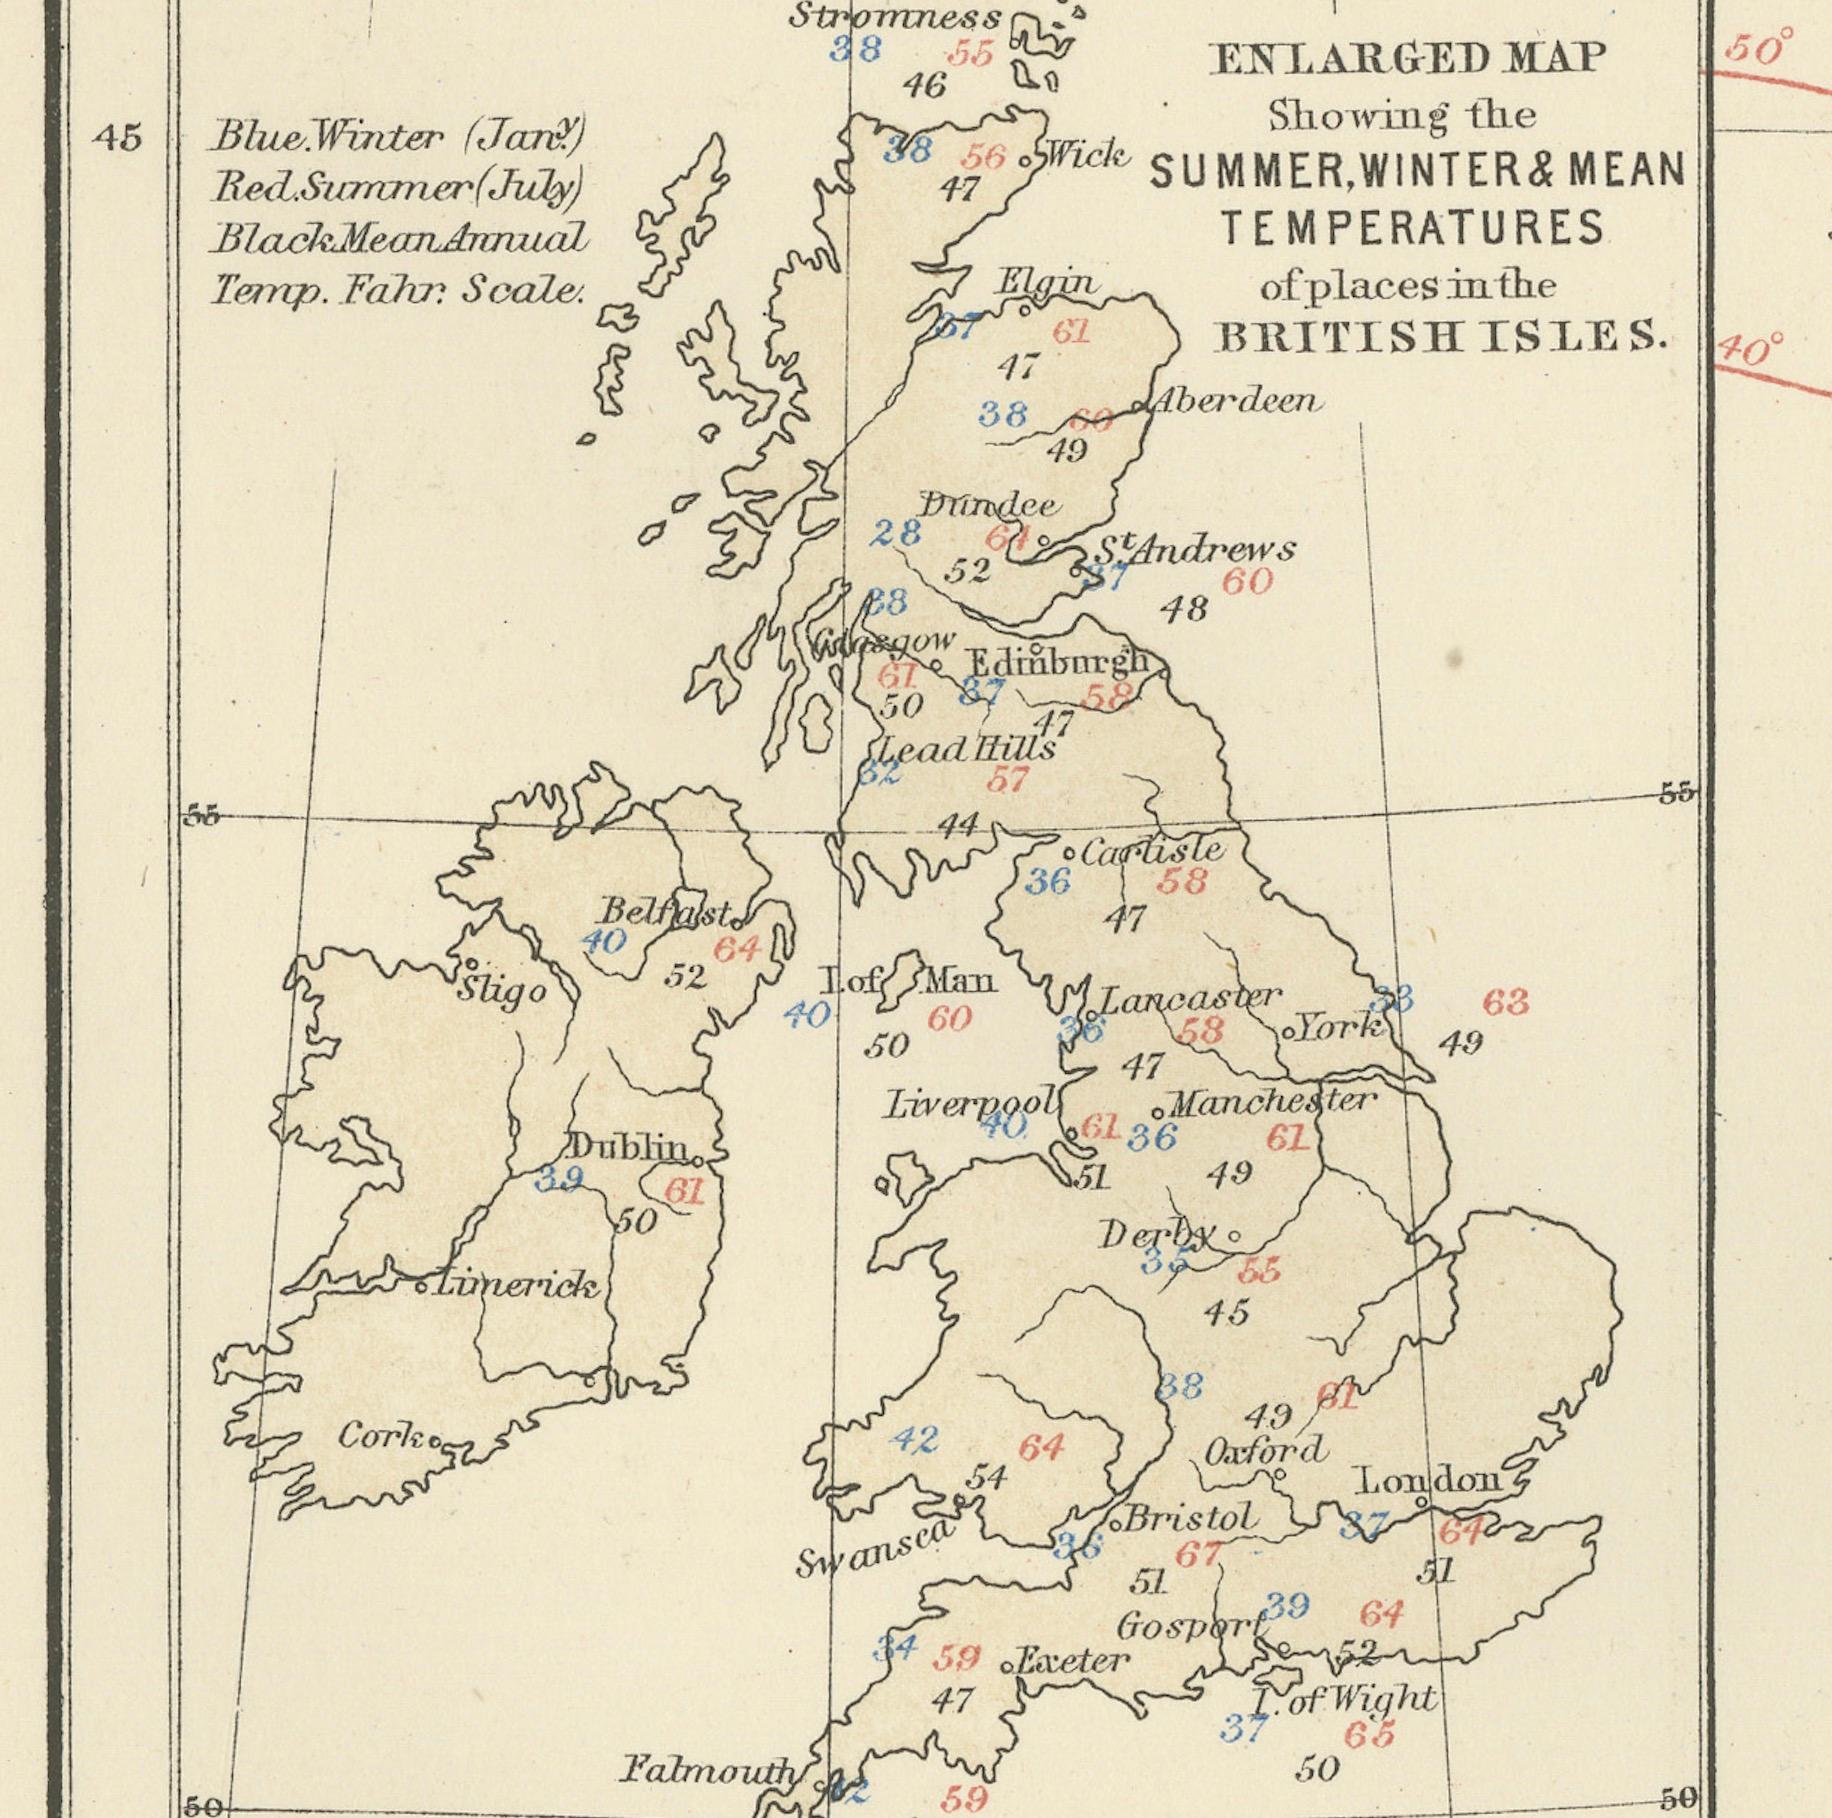
The chart also includes two detailed insets. One shows the British Isles with a focus on summer and winter mean temperatures by city and station, while the second presents similar data for Central Europe. These regional maps offer insight into 19th-century meteorological science and the importance of regional climate comparisons in early climatology.
Johnston’s meticulous work combines data with elegant cartographic design. His maps are not only valuable scientific tools but also highly decorative. Johnston (1804–1871), Geographer in Ordinary to Queen Victoria in Scotland, was instrumental in the development of thematic cartography. His *Physical Atlas* remains one of the most influential scientific atlases ever published, appreciated for its beauty and clarity as much as for its content.
This plate is particularly interesting for its foresight in climate science and as an early visual reference to global temperature distribution—concepts that underpin today’s environmental studies and climate models.
Condition and framing tips: Good condition with light age toning and minor wear at the margins. Image field clean and sharp. Frame in matte black or dark walnut with a cream or ivory mat to highlight the fine engraved lines and soft red and blue temperature curves. Ideal for scholars, educators, and interiors with a natural history or scientific theme.