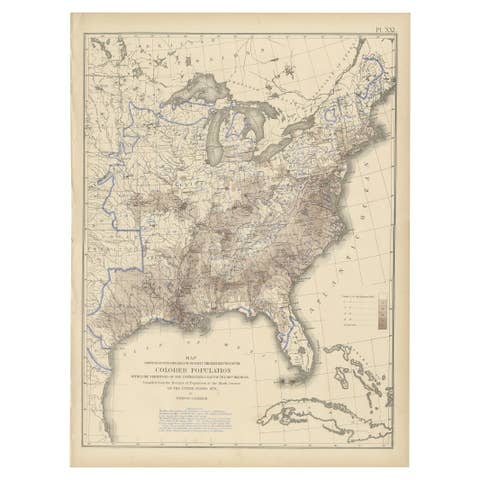
Pl. 22 Antique Chart of the US Colored Population Proportion in 1870, '1874'
€ 450
Original antique · The actual sheet photographed · Certificate of authenticity on request · Sold unframed · Worldwide shipping from € 15 (rates)
Date
1870
Sheet size
55 × 41 cm (21.7 × 16.1 in)
Condition
Good
Reference
BG-11875-18
What the condition grades mean
Excellent
Bright and clean, with no faults worth mentioning.
Very good
Only light signs of age, such as faint toning.
Good
Normal signs of age for a sheet of this period: toning, some foxing, small marks or neat old repairs.
Fair
Clear faults such as staining, tears or repairs, priced to match.
Every fault we see is written in the condition note, and the whole sheet is shown uncropped in the photos.
Condition
General age-related toning, minor wear. Blank verso. Please review the images for further condition details.
About this sheet
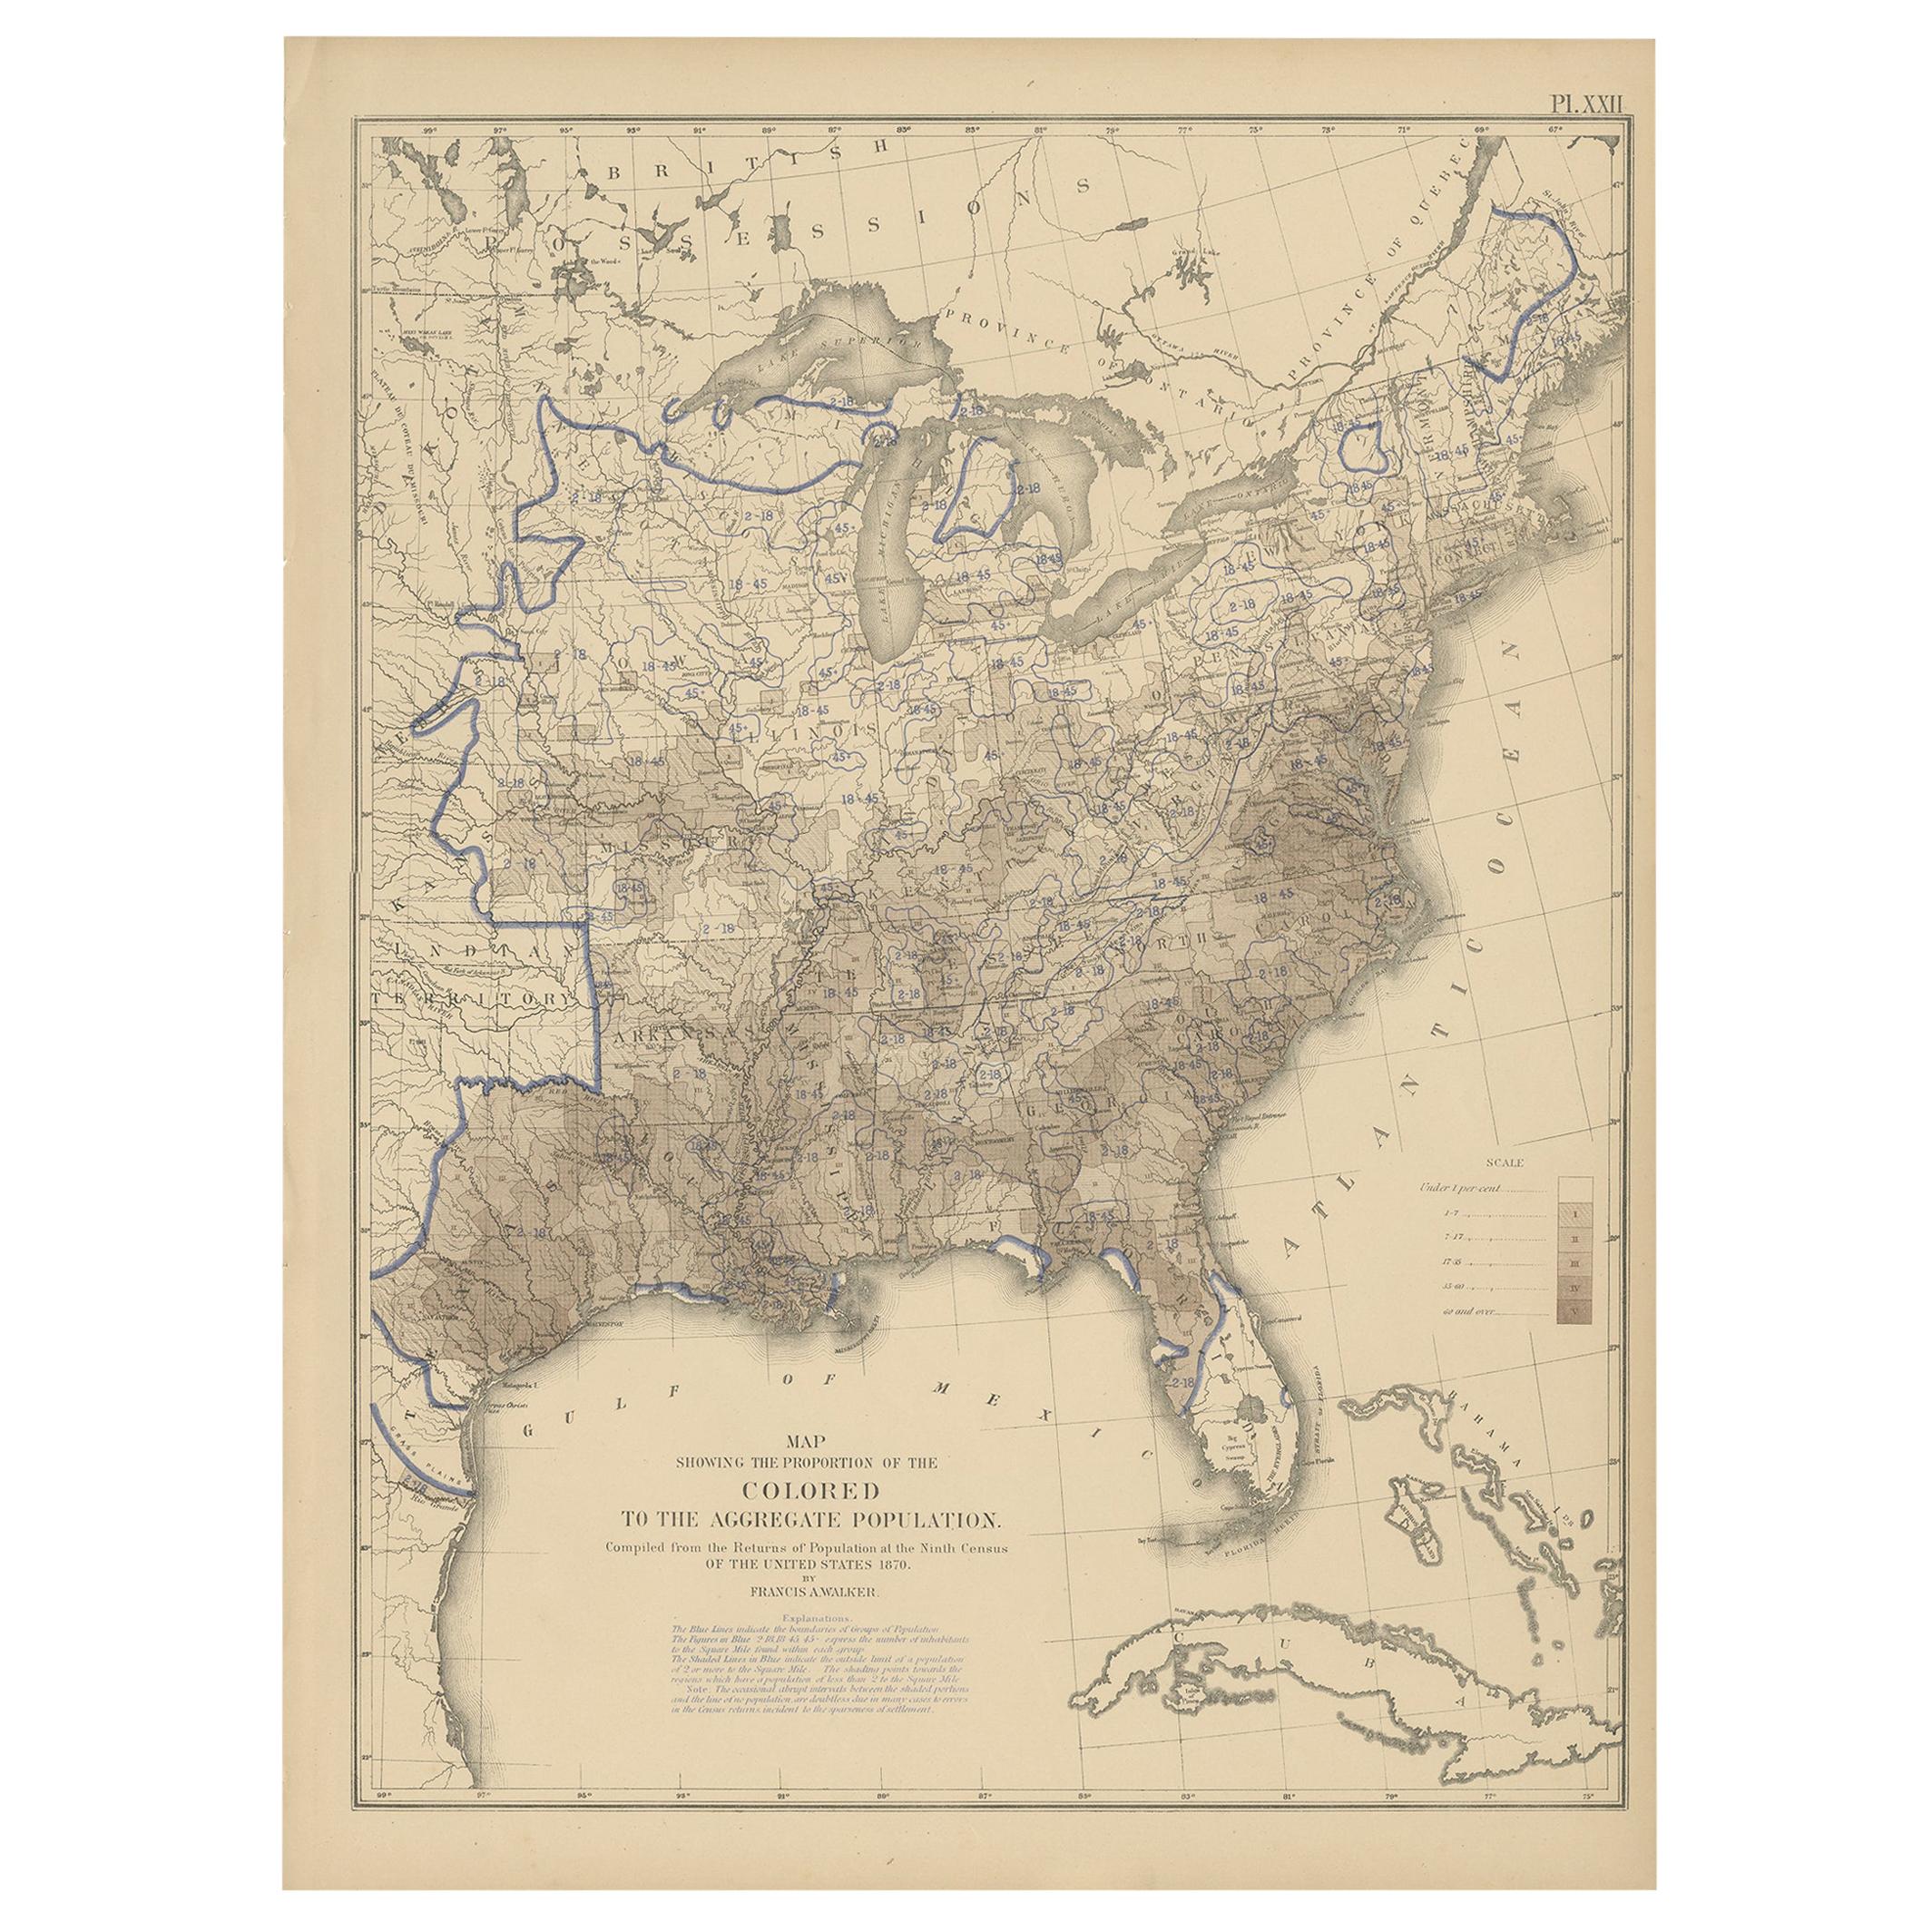
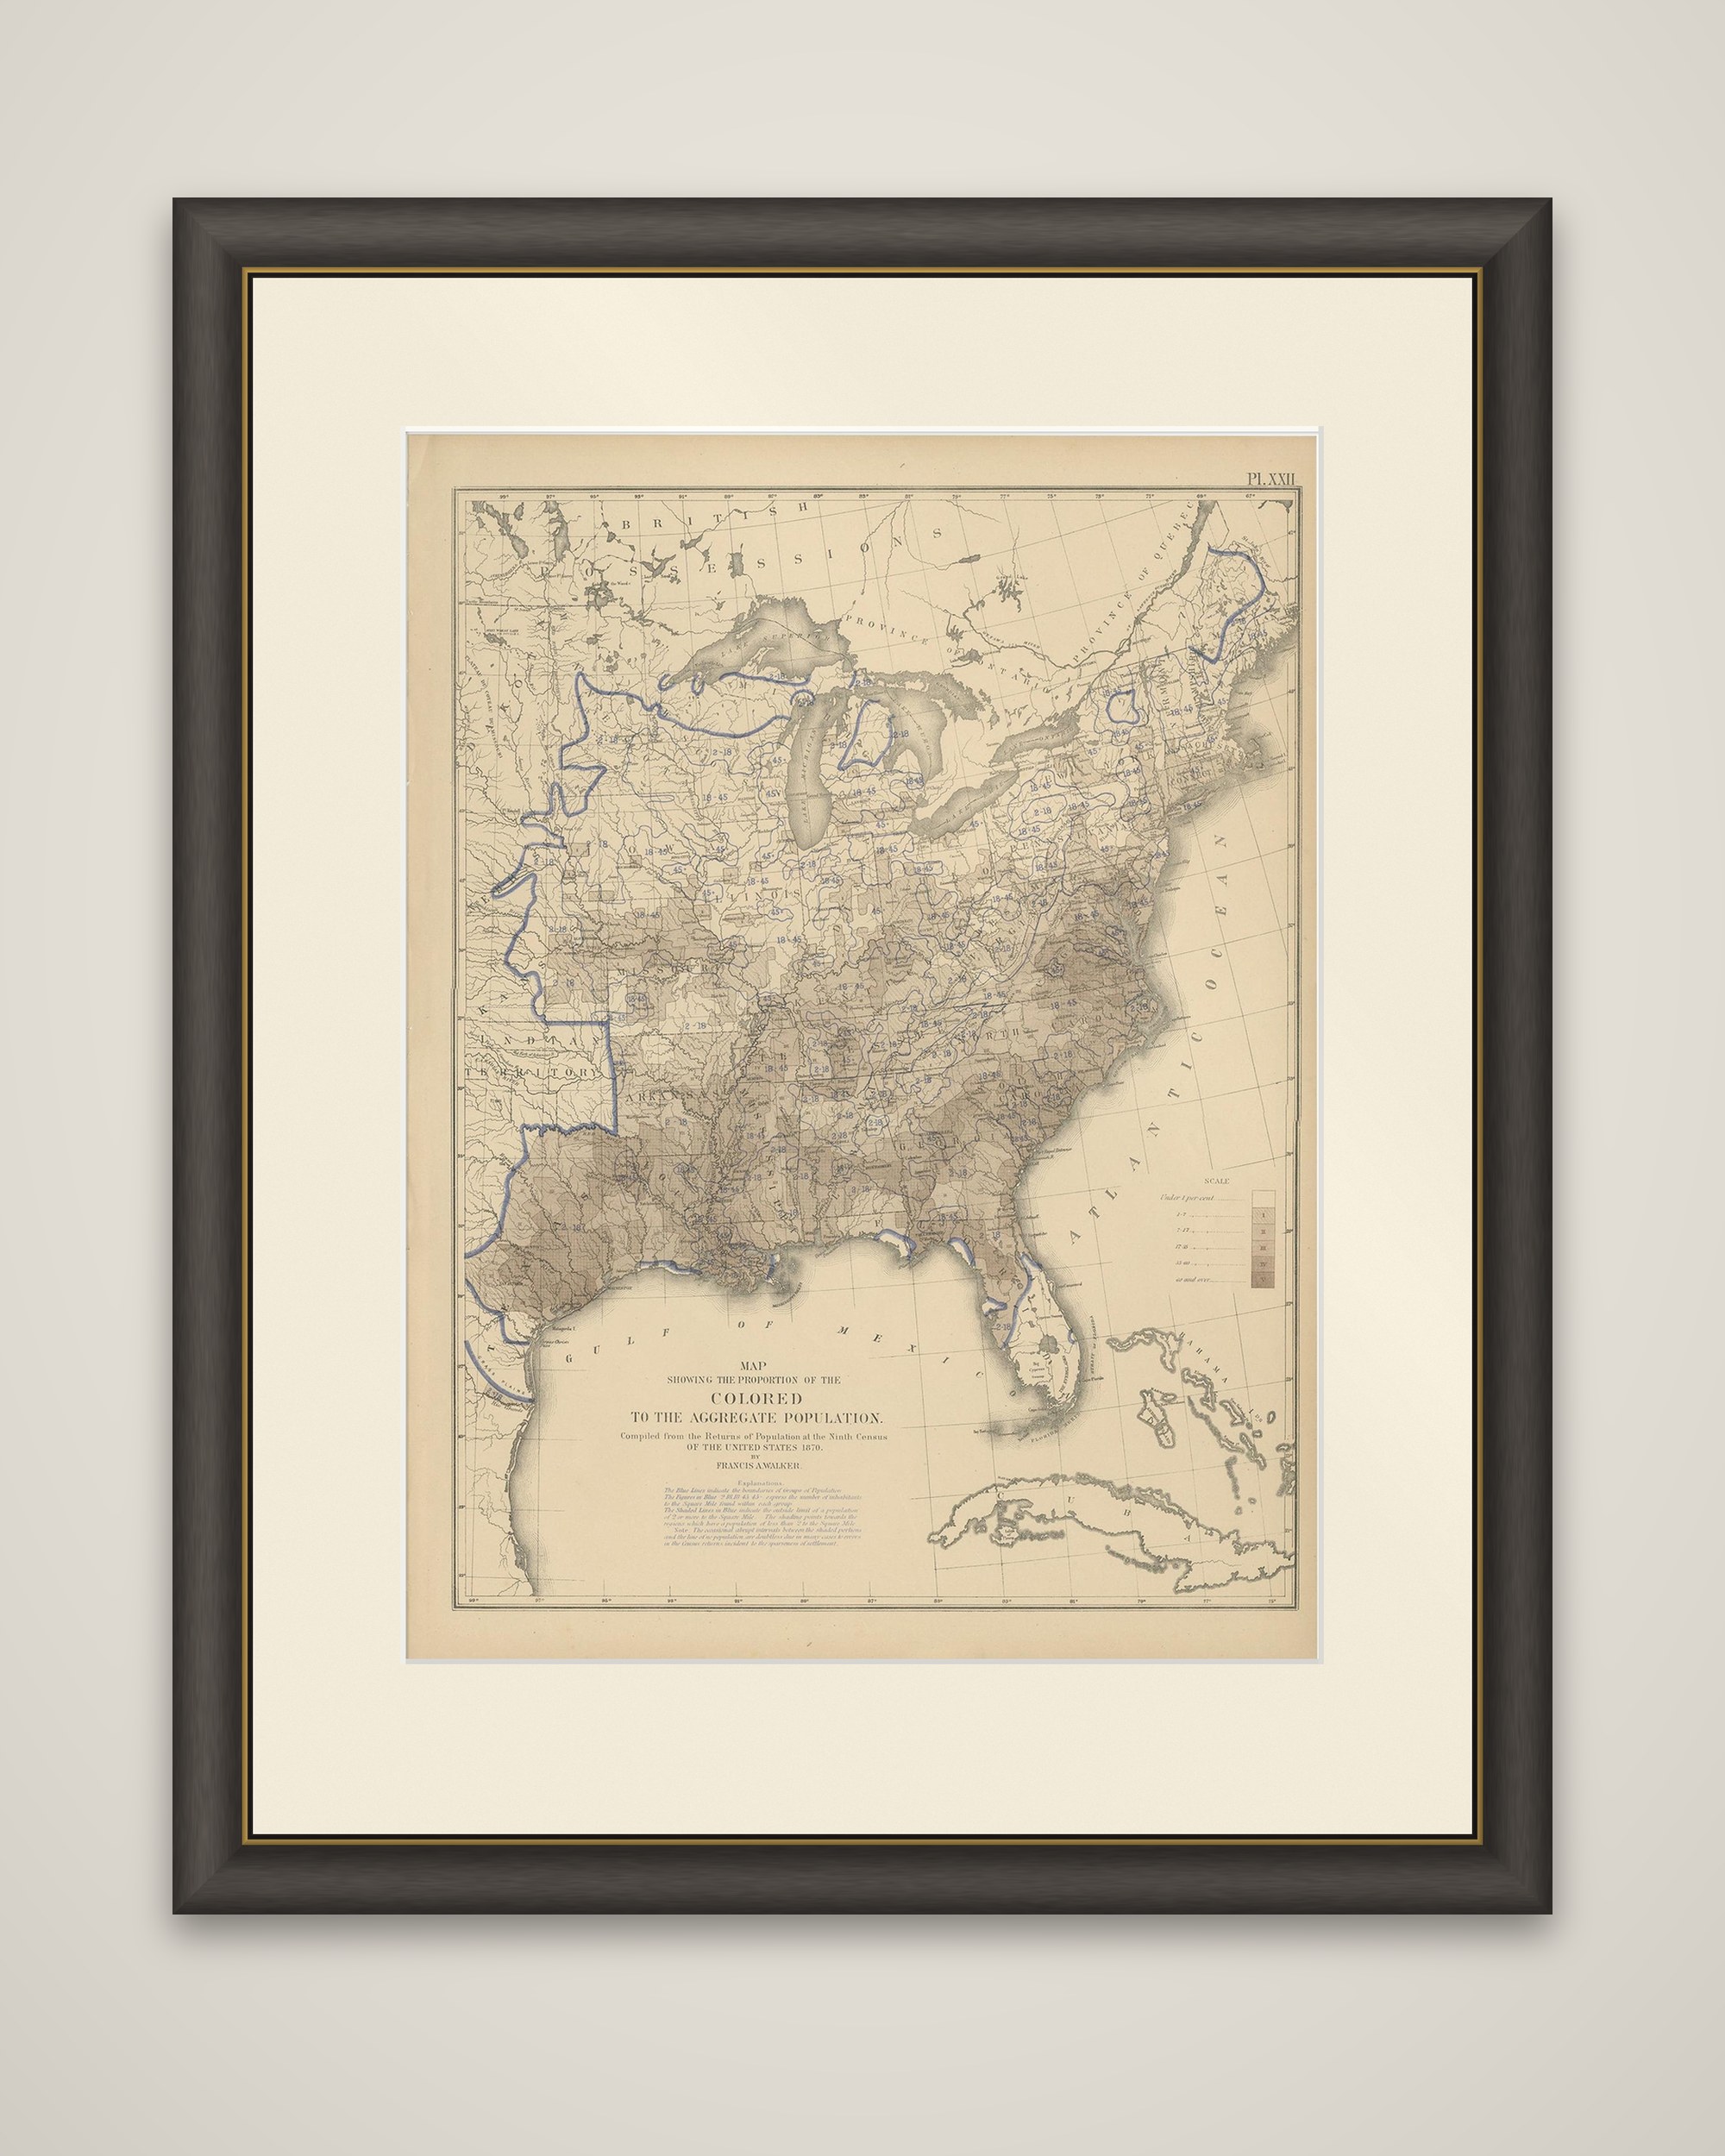
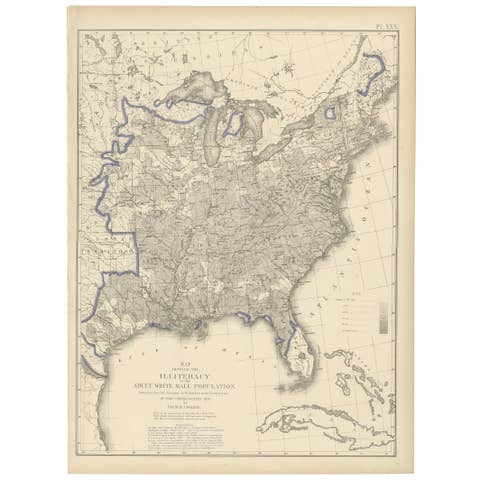
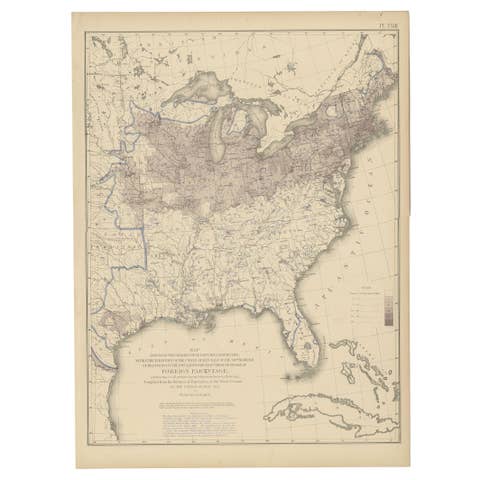
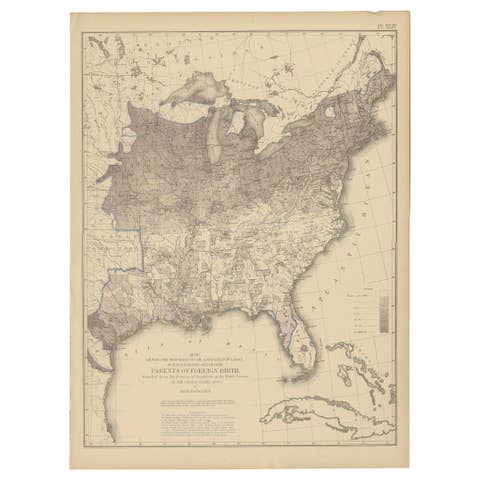
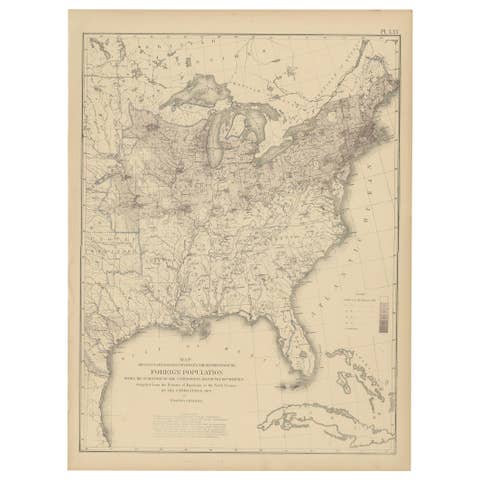
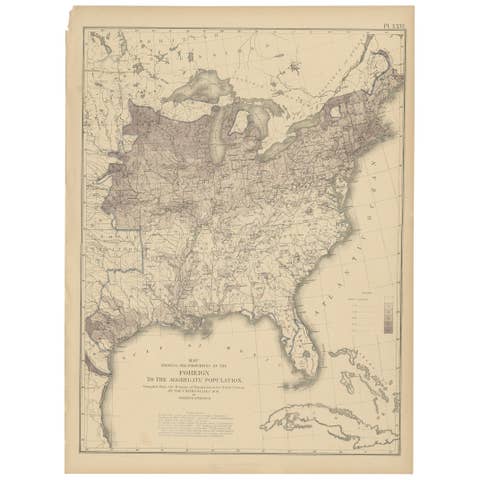
The proportion of the colored population of the United States in 1870, an original color lithograph (Plate XXII) from the Statistical Atlas of the United States based on the results of the ninth census 1870, compiled by Francis A. Walker and published in 1874. The title reads "Map showing the proportion of the colored to the aggregate population", compiled from the returns of population at the ninth census.
The map covers the United States east of the 100th meridian, with the Great Lakes, Florida and the Gulf of Mexico outlined, and Cuba and the Bahamas drawn at the lower right. Counties are tinted in brown, graded by a scale at the right, and the darkest tones form a broad band through the South, from the Atlantic coast of the Carolinas and Georgia across Alabama and Mississippi to the Mississippi valley. Small figures and blue lines mark districts across the map, and an explanation is printed beneath the title.
The term "colored" is the one used by the census of the period.